|
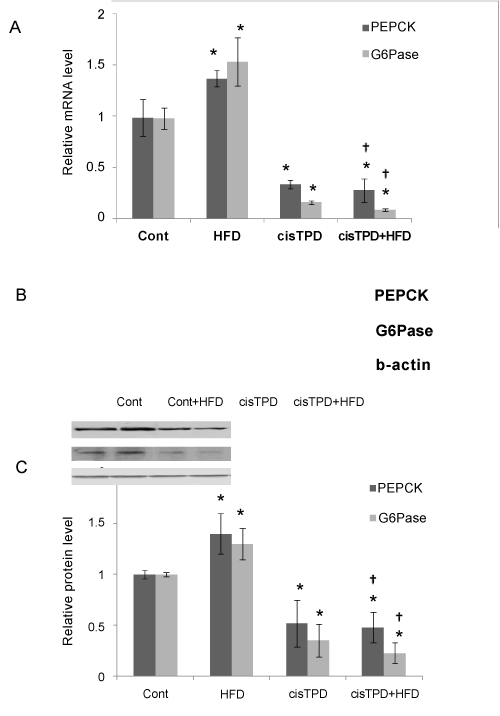
| Figure 4: Effect of long-term cisTPD treatment on PEPCK and G6Pase genes expression and protein levels in normal diet and HFD rat livers. A) Total RNAs were prepared and subjected to RT-PCR for measurement of mRNA. Fold change was expressed by taking the corresponding value of the control rats as one. Bars mean ± S.D (n=5). *Indicate a significant difference from control animals (p< 0.05); †Indicate a significant difference from HFD animals (p<0.05). B) Representative Western blots of PEPCK, G6Pase and b-actin. Whole-cell extracts were prepared from rat livers and subjected to Western blot analysis using anti-PEPCK, anti-G6Pase or anti-b-actin antibodies as described under “Materials and methods”. C) Relative intensity. The protein bands were analyzed by the computerized densitometric program “Total Lab”. The intensities of the signals were determined from the areas under the curves for each peak and data were graphed. Beta-actin was used as internal control to which PEPCK and G6Pase were normalized. Fold change was expressed by taking the corresponding value of the control as one. Bars mean ± S.D (n=5). *Indicate a significant difference from control animals (p< 0.05); †Indicate a significant difference from HFD animals (p< 0.05). |