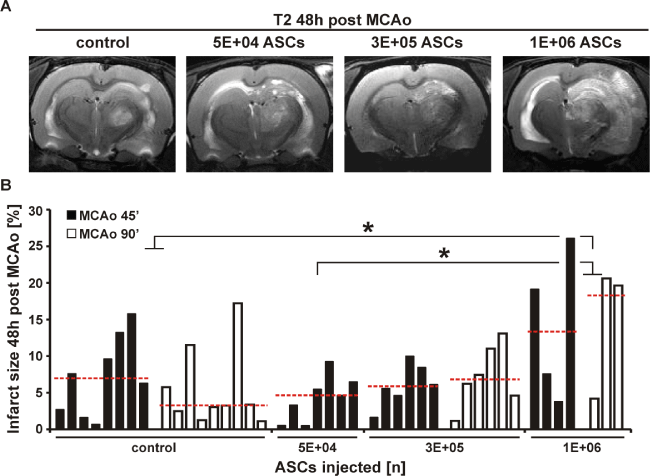
(A). Differences in infarct volumes obtained 48h post MCAo are shown for all treatment groups. Groups are the same as in figure 1. Median for each group was indicated as red dotted line. Each column represents infarct volume as percentage of total individual brain volume for one animal. *p < 0.05 for 1E+06 ASC group vs. control group and 5E+04 ASC group
(B). ASC = adipose tissue derived stem cell; ΔCSI = difference in cell signal intensity. MCAo = middle cerebral artery occlusion.