 |
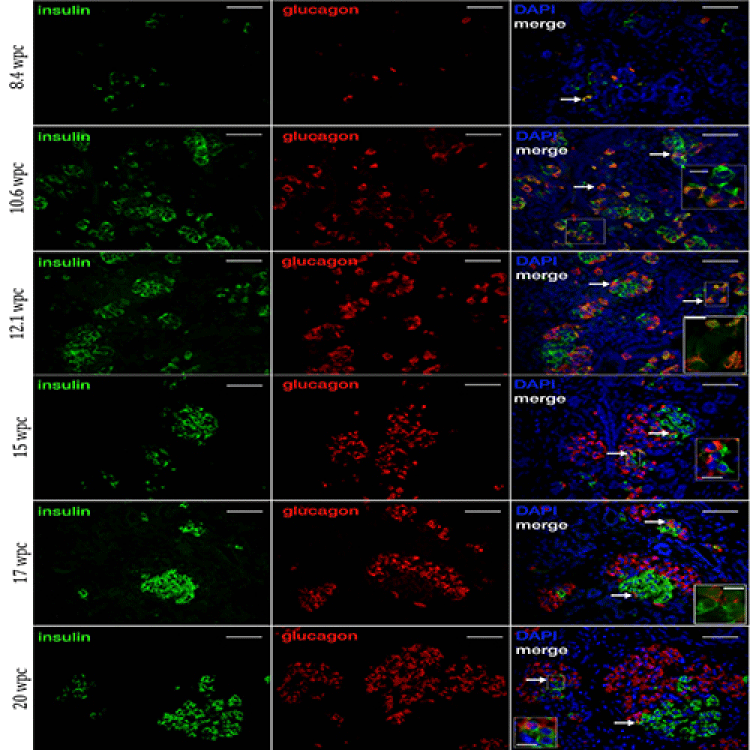
| Figure 1: Insulin (green) and glucagon (red) expression during the first and second trimester of human fetal development (1- 24 wpc), as demonstrated by samples 8.4, 10.6, 12.1, 15, 17, and 20 wpc. Arrows demonstrate examples of coexpressing insulin and glucagon cells. Prior to 8.4 weeks there is no positive insulin or glucagon staining. At 8.4 wpc insulin and glucagon expression is observed in scattered cells. By 10.6 wpc insulin and glucagon expression has significantly increased, and the first islet-like clusters are visible, consisting mostly of insulin positive cells, while a few insulin and glucagon co-expressing cells are observed on the periphery of the clusters. Islet size continues to increase between 10.6 and 12.1 wpc. During the second trimester, islet size continues to increase and glucagon expression is greater than insulin expression. In the second trimester, the majority of insulin and glucagon expressing cells are localized to islet structures rather than as isolated cells and self-aggregate. DAPI nuclear counterstain (blue). Areas denoted by a box are shown at higher magnificiation (inset). Higher magnification images of 12.1 and 17 wpc are shown without DAPI. Scale bars are 50 and 10 μM respectively. |