 |
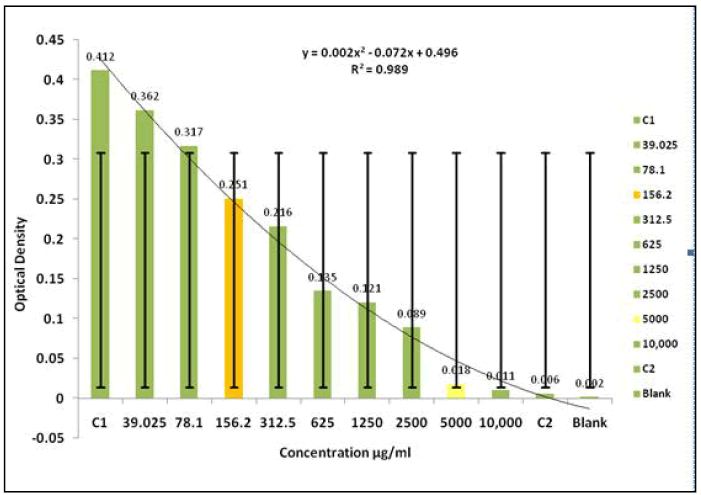
| Figure 3: Graphical representation of MIC and MFC of Fraction 4 on M. globosa . The MIC was recorded at 156.2 μg/ml and MFC at 5000 μg/ml. The error bars depicts the gradually deviating optical density in each reading which maximizes at C1 and minimizes at blank. |