 |
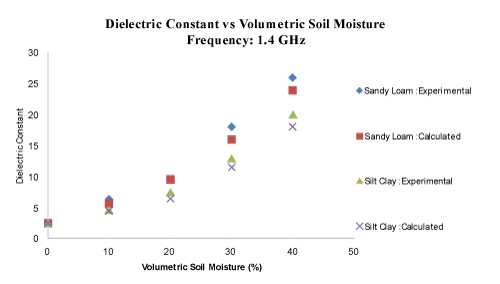
| Figure 1: Variation of Dielctric constant with the increase in volumetric soil moisture at 1.4 GHz obtained with the computed values of u, v, and x (equation 2). The texture data are as shown in table 1, where the computations are carried out at descrete points (shown as markers). |