 |
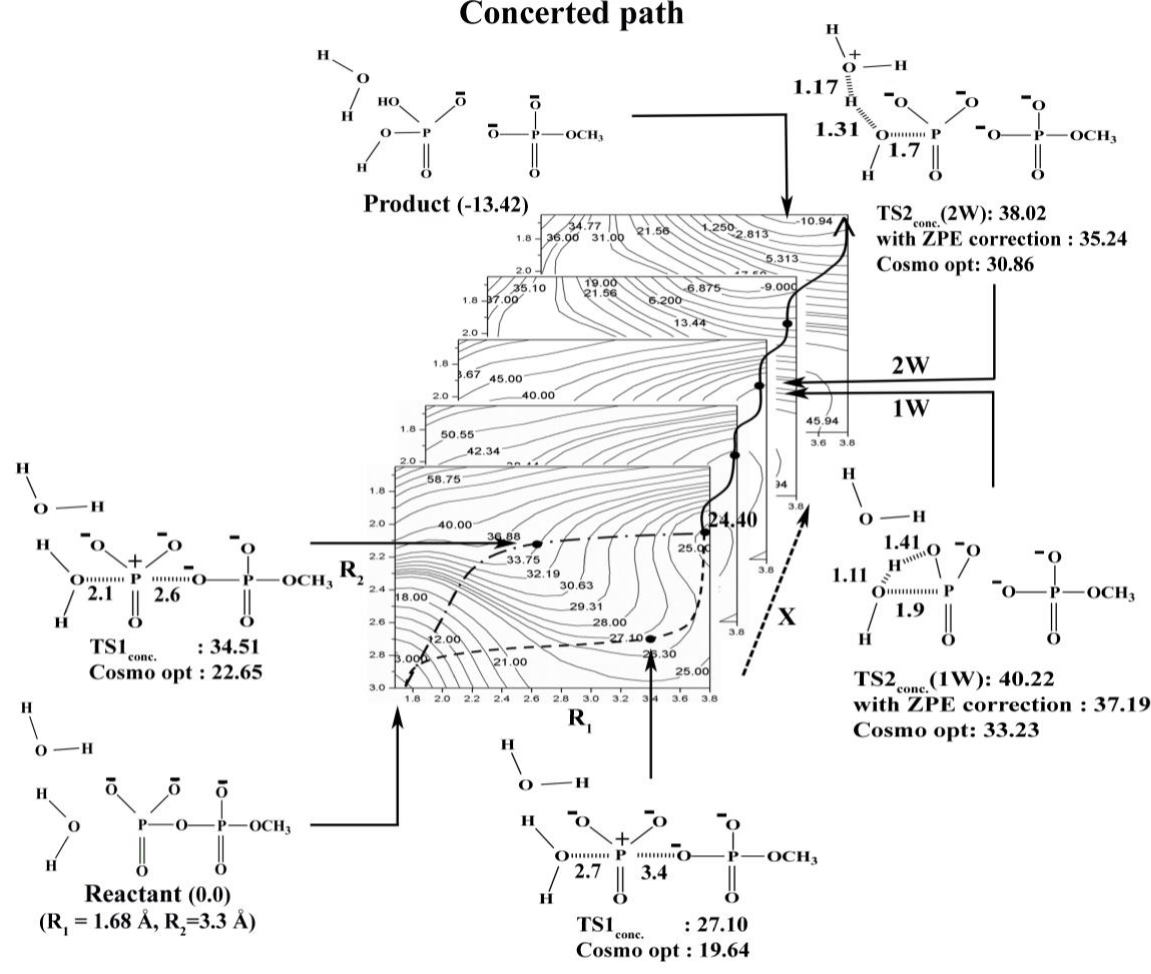
| Figure 1: The calculated free energy surfaces for the hydrolysis of monomethyl pyrophosphate trianion in solution for the path that starts with an associative and dissociative paths that follows by a late PT to the phosphate oxygen . As seen from the figure the rate determining TSs for the 2W and 1W have similar energies. Note that the activation entropy of the 2W path ( which is not included ) should be larger than that of the 1W barrier. The surfaces are drawn as functions of R1, and R2 for several values of the proton transfer coordinate X, and focuses on the comparing the PT barriers that starts from the intermediate where R2 is around 2 A and R1 is partially broken. The transition states on the surface were explored by starting with locating corresponding gas phase transition state, solvating it by IEF-PCM , and then reevaluating the relevant energy in solution by constrained Cosmo minimization. |