 |
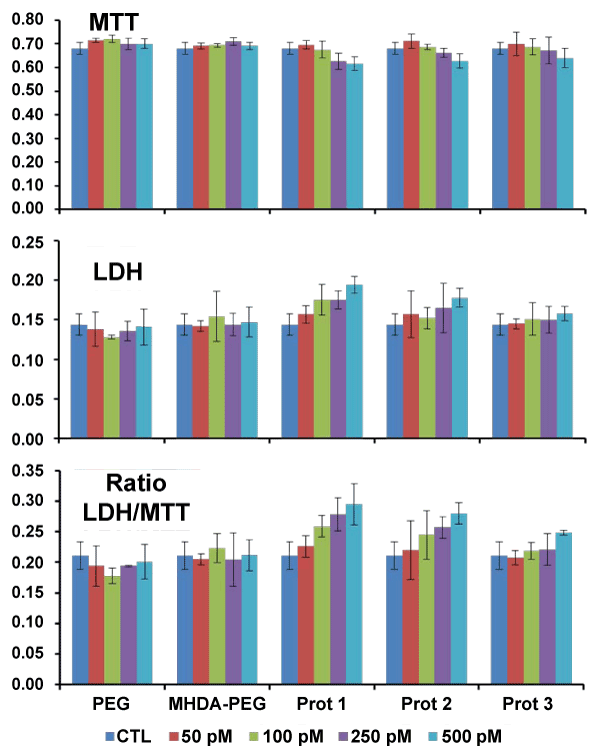
| Figure 7: Metabolically active cells (MTT assay), LDH release, and ratio between LDH release and MTT following incubation of BT 474 cell with GNR conjugates for 48 h, at concentrations up to 500 pM (or 3 × 10¹¹ GNR/ml). Synthesis steps for protocols 1, 2 and 3 are the same as in figure 4 (mean ± SD, n=6 independent measures for each conjugate). All protocols show significant level of cell death, from Prot 1 (highest) to Prot 3 (lowest). |