 |
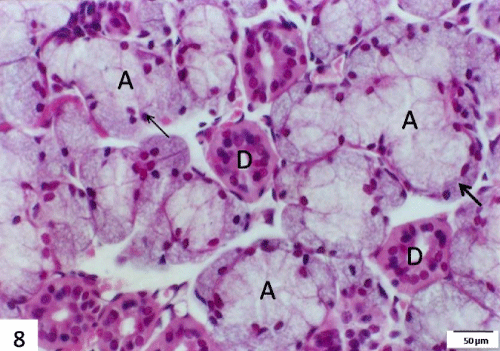
| Figure 8: A section in the submandibular gland of 7 days starved group stained with H&E showing slightly hypertrophied acini (A) with deeply stained nuclei (thin arrow), prominent serous demilune (thick arrow) and striated ducts (D) with more acidophilic cytoplasm.) Scale bar=50 μm). |