 |
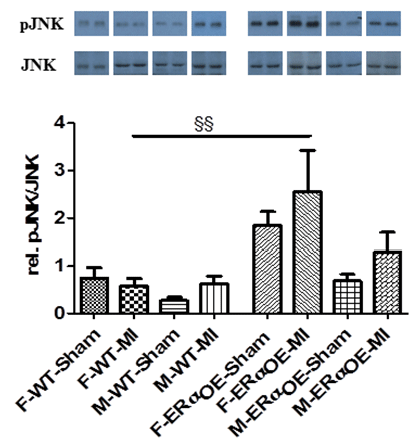
| Figure 5: Phosphorylation level of JNK (pJNK) is increased in only female ERα-OE mice hearts. Representative Western blots (top) and bar graph(bottom) representing the quantitative Western blot analysis of pJNK in LV tissues from female and male WT and ERα-OE mice. Data are expressed as ratio of pJNK to JNK expression. Bars represent the mean ± SEM of 7 to 8 animals per group. § for genotype effect: p<0.01. |