 |
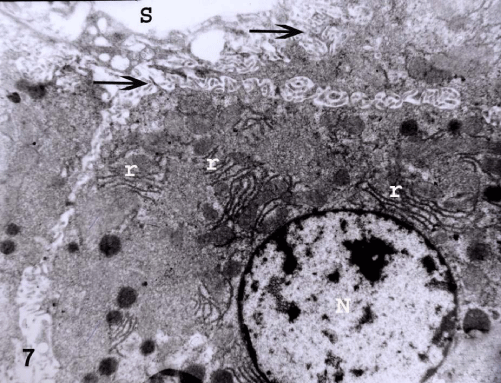
| Figure 7: An electron micrograph from a section in the liver of control group I showing hepatocyte with euchromatic nucleus (N) and regular rough endoplasmic reticulum (r) and long microvilli (arrows) projecting toward blood sinusoid (S). (TEM X 11000). |