 |
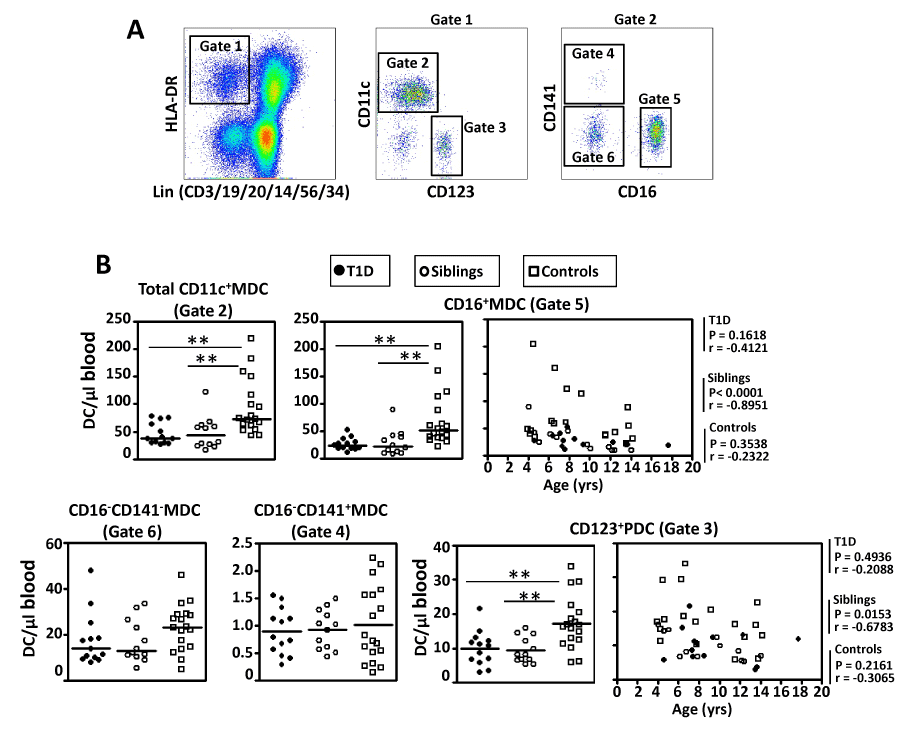
| Figure 1: Enumeration of blood MDC and PDC. (A) Gating strategy for defining multiple blood MDC subsets and PDC. Left dot plot: events shown are gated upon CD45+ WBC. Middle dot plot: total CD11c+MDC (Gate 2) and CD123+PDC (Gate 3) are gated upon Lin-HLA-DR+ cells (Gate 1). Right dot plot: CD16-CD141+MDC (Gate 4), CD16+Cd141-MDC (Gate 5) and CD16-CD141-MDC (Gate 6) are gated upon CD11c+MDC (Gate 2). (B) Scatter plot of the absolute number of total CD11c+MDC (median), CD16+MDC (median), CD16-CD141-MDC (median), CD16-CD141+MDC (mean) and CD123+PDC (mean). Absolute numbers of CD16+MDC and CD123+PDC correlated with age in T1D children, siblings and controls (Spearman P and r value). *, P < 0.05; **, P < 0.01. |