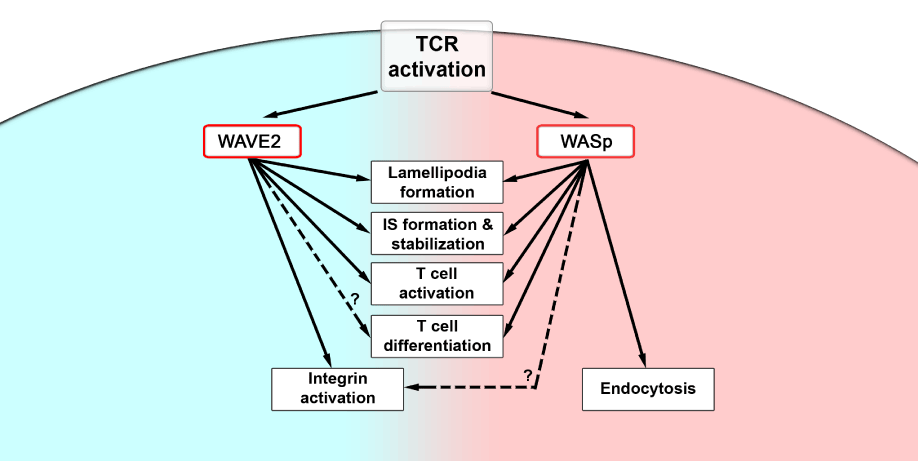
Figure 2:
Schematic representation of WASp and WAVE2 common and distinct function in T cells
. WASp (Right) and WAVE2 (Left) control both common (Middle) and distinct cellular processes. Arrows with broken lines indicate speculative involvement.