 |
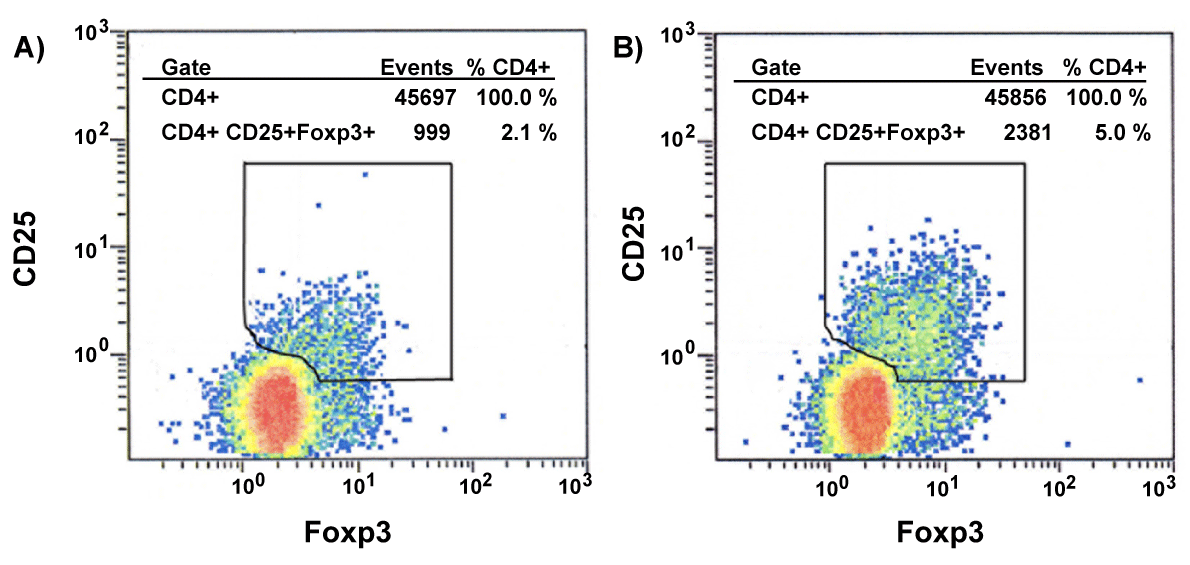
| Figure 3: Flow cytometry analysis of the frequency of CD4+CD25+Foxp3+ cells within the CD4+ T-cell population. Representative plots are shown. The framed dots represent CD4+CD25+Foxp3+ T cells (Tregs). The percentage of Tregs in patients (A) and controls (B) was 2.1% and 5.0%, respectively. |