 |
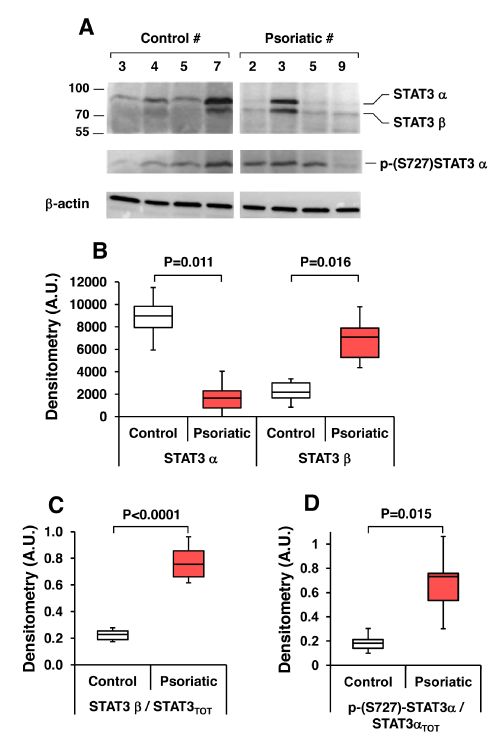
| Figure 6: Assessment of STAT3 isoforms protein in control and psoriatic PBMC. (A) Representative Western blotting of total cell protein extract (40 μg/ lane) from four control and four psoriatic PBMC. STAT3 was immunodetected as doublet band in the 70-100 KDa range. (B) Box-plot representation of the densitometric analysis of the immunodetected STAT3α and STAT3β bands normalized to b-actin. (C) Box plot representation of STAT3β/STAT3TOT (i.e. total STAT3) as densitometric ratio. (D) Box plot representation of p-(S727)- STAT3 α/STAT3 αTOT as densitometric ratio. White boxes, control; red boxes, psoriatic. Statistically significant differences are shown as P. The data reported in panels (B-D) refer to the whole cohort of healthy and psoriatic subjects enrolled in this study (see Materials and Methods for details). |