 |
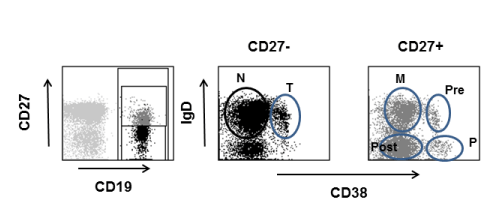
| Figure 2: B cell subsets based on the expression of CD27, IgD and CD38. A representative example of the gating strategy used in the phenotype analysis is shown. Mononuclear cells were stained with monoclonal antibodies against CD19, CD27, IgD, CD38 and cells were gated on CD27-CD19+ and CD27+CD19+ respectively. Different B cell subsets are indicated as follows: N=naïve, T=transitional, M=memory, pre=pre-GC, post=post-GC and P=plasmablasts. |