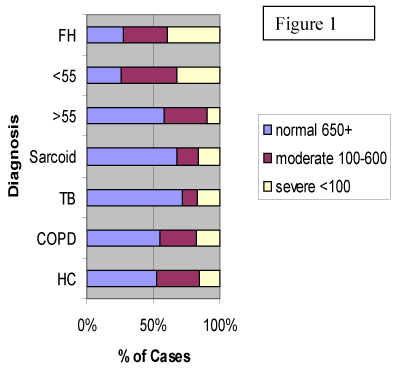
| Groups ;- Analysis of frequency Distribution by chi-square | % MBL >650 | % MBL 100-600 | % MBL <100 | HC P value |
| Healthy controls (HC) | 53 | 32 | 15 | |
| COPD | 55 | 27 | 18 | Ns |
| TB | 72 | 11 | 17 | 0.001 |
| Sarcoid | 68 | 16 | 16 | 0.024 |
| IPF>55yrs | 58 | 32 | 10 | Ns |
| IPF<55yrs | 26 | 42 | 32 | 0.001 |
| IPF & FH | 27 | 33 | 40 | 0.001 |