|
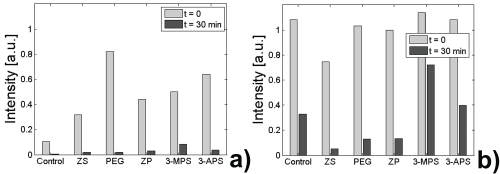
| Figure 4: Normalized residual fluorescence intensity measurements after sodium borate buffer flushing of a) BSA and b) IgG through a straight microfluidic channel. The light and dark bars represent, respectively, the fluorescence values at the beginning and after 30 minutes of flushing. The proteins were introduced in a continuous flow until the measured fluorescence value did not show any change (20-30 minutes). At that point (t=0), the channel was rinsed with sodium borate buffer, while fluorescence was measured at regular intervals, until the fluorescence became as close to the initial intensity value as possible (t=30 min). Fluorescence values are corrected by subtracting background and dividing by flat field values. |