 |
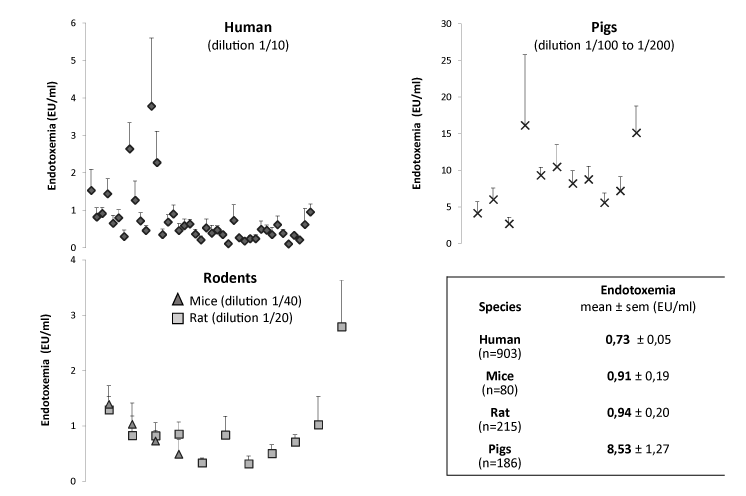
| Figure 1: Endotoxemia of different plasma samples from humans, mice, rats, and pigs. Each symbol represents a mean ± sem of one plate with 21 samples. Mean endotoxin concentrations obtained for each species on all tested samples (regardless of fasting or postprandial state of plasma or dietary interventions) are summarized in the inset table (mean ± sem; EU/mL). |