 |
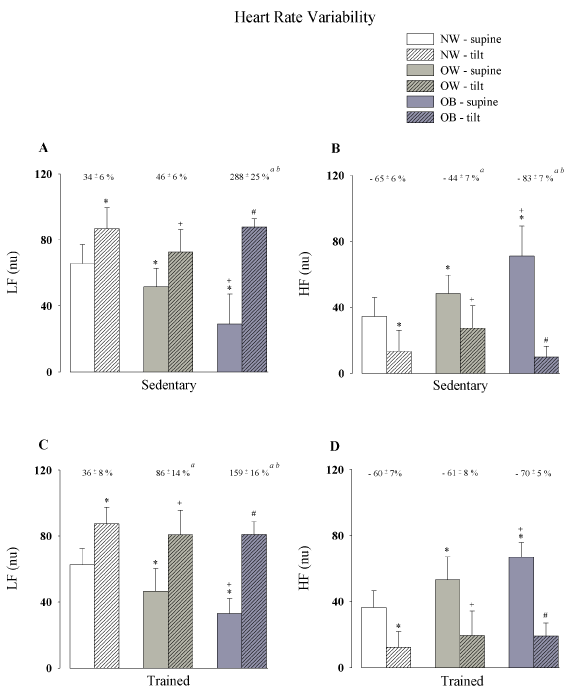
| Figure 1: Spectral power density of R-R interval in low (LF) and high frequency (HF) bands in normalizes units (nu) during supine position and tilt test calculated from time series in sedentary and trained volunteer’s participants. Normal Weight (NW group); Overweight (OW group); and Obese (OB group). aP<0.05 vs. NW group; bP<0.05 vs. OW group; cP<0.05 vs. OB group. |