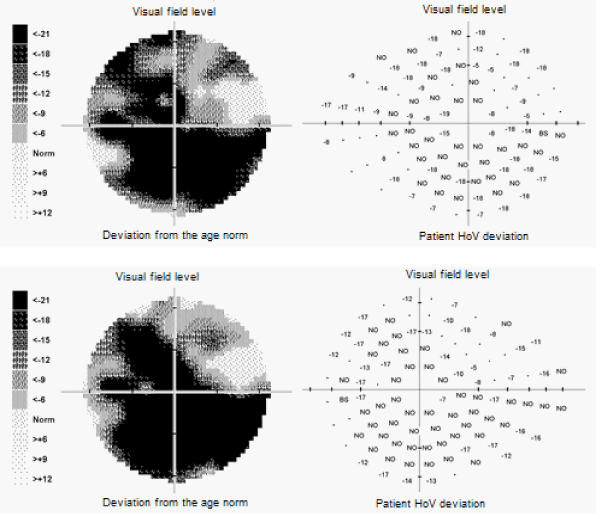
 No = an absolute scotoma, negative numerical values illustrate the drop in dB.
  No = an absolute scotoma, negative numerical values illustrate the drop in dB.
 |
| Figure 4: Top - right visual field, bottom - left visual field of the same patient. On the left is sensitivity in the visual field shaded in grey, on the right is the sensitivity drop compared to a normal visual field. |