|
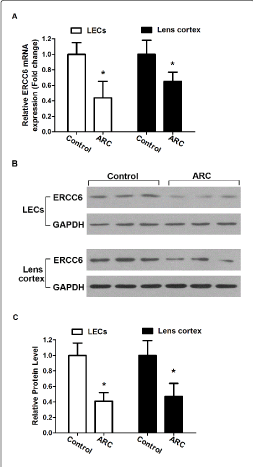
| Figure 1: Relative expression of mRNA and protein levels of ERCC6 in LECs and cortex of control and ARC lens (A) Quantitative RTPCR analysis of the mRNA of ERCC6 in control and ARC lens. Values represent mean ± SD. *: P <0.01 (B) Western blot analysis for protein expression of ERCC6 in control and ARC lens. (C) Relative ERCC6 protein level to GAPDH is presented as mean±SD. *: P<0.01. |