 |
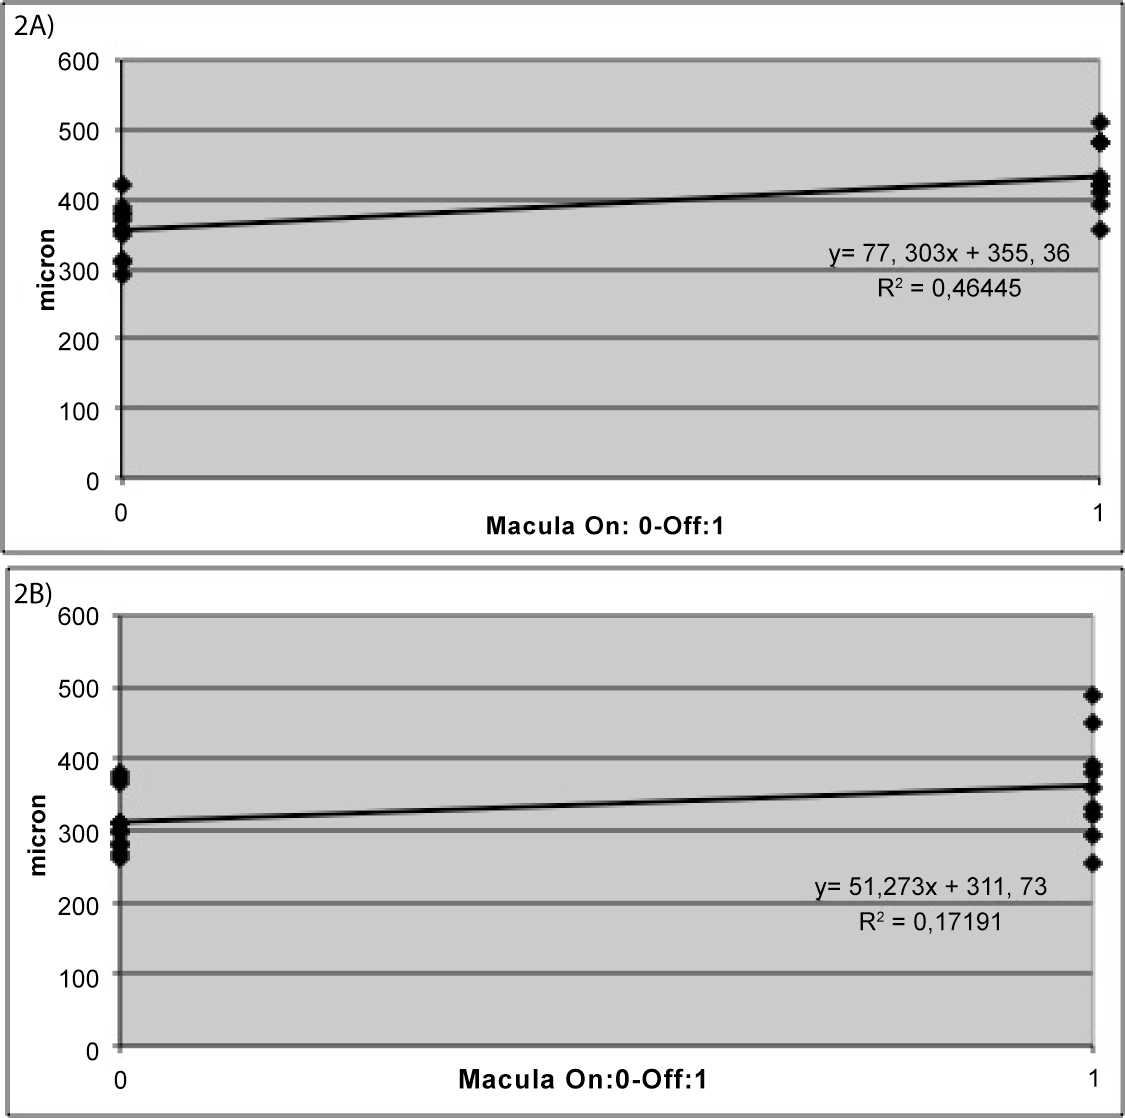
| Figure 2: Graphic representation of correlation between preoperative macular status (macula on: 0; macula off: 1) and macular edema: a) at month 1 with intraocular SO (r: 0.68); b) at month 1 after surgery for SO removal (r: 0.41). Dots represent each eye data, continuous line represents the statistical tendency. The equation defines the statistical correlation. |