 |
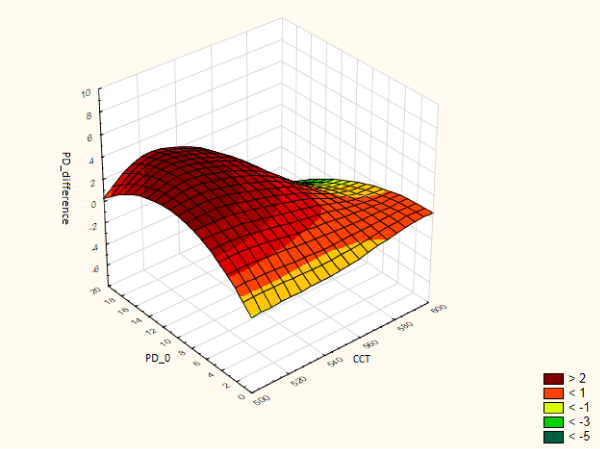
| Figure 3: Graphical representation of the dependency using 3D xyz graph. In the 3D xyz graph on the vertical axis z, the PD variable (differences in values over time) is applied. The PD variables at time 0 and corneal thickness are represented graphically in the axes x and y at the base. From the shape of the graph, we can see that with decreasing thickness of the cornea and increased PD value at time 0, the rate of progression of PD increases. Conversely, with increasing thickness of the cornea and decreasing PD value at time 0, the rate of progression of PD decreases. |