 |
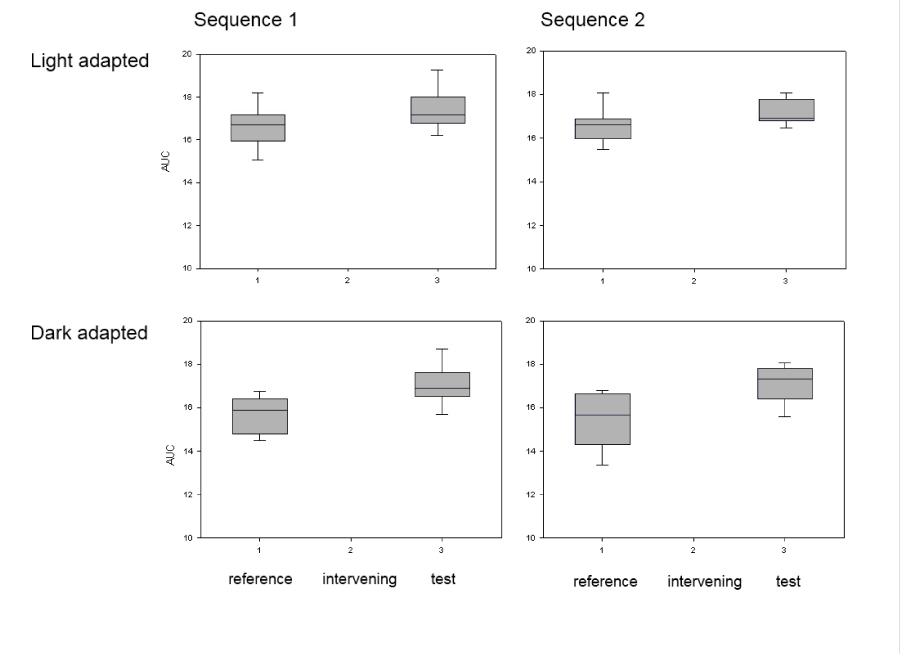
| Figure 3: Box plot showing AUC. AUC during exposure to blue light in the light adapted state (upper panel) and after 30 minutes of dark adaptation initial to the reference stimulus (lower panel) for the two test sequences. Data are given as area under the curve (AUC) for the first reference blue stimulation and the third test stimulus, intervening stimulation of either blue or red are not shown. Both for sequence 1 (intervening blue) and sequence 2 (intervening red) the AUC for the final test stimulus was significantly increased compared to the initial stimulation, in particular for the dark adapted state. The AUC of the first reference blue stimulus following light adaptation was larger than the AUC for first reference blue stimulus following dark adaptation for both sequences 1 ( P = 0.08) and 2 ( P = 0.05). |