 |
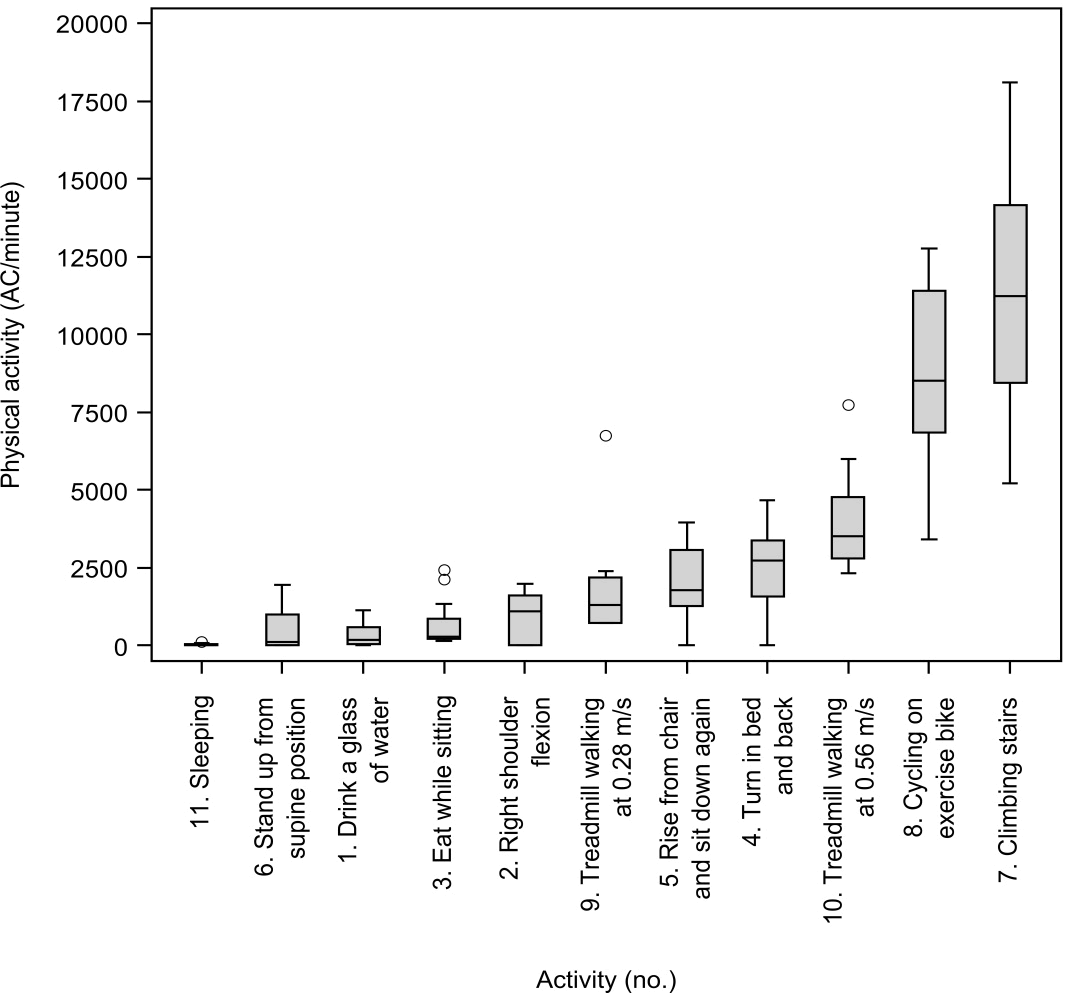
| Figure 1: The distribution of total AC/minute during 11 differentactivities, series 2, shown as a box and whiskers plot (n=12, 1patient excluded due to MD; for activity 11: n=10, 1 patientexcluded due to MD and 2 patients excluded due to lack ofrecording). The length of the box represents the interquartile rangewith the group median shown as an interior horizontal line. Thewhiskers represent values from the upper or lower boundary of thebox plus or minus 1.5 × the interquartile range with outliers outsidethis range represented by circles. Detailed description of activities isexplained in the article. |