 |
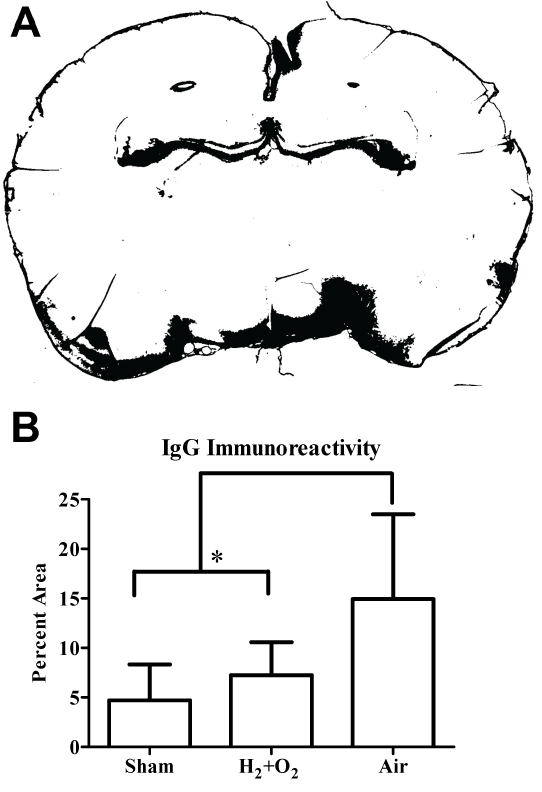
| Figure 3: Quantification of IgG Immunoreactivity. (A) A section stained with anti-IgG antibody and subjected to thresholding as described in Methods. This section is from an animal exposed to a compressed-air driven blast, and corresponds to the third section from the left in the bottom row of Figure 2. (A). The percentage area of the slice that was positive for IgG immunoreactivity was averaged. Brains from rats exposed to compressed air-driven shockwaves exhibited more area immunoreactive to IgG than sham- or oxyhydrogen-driven blast-exposed rats at 3h post-injury. (B). One-way 21 ANOVA with Student Newman-Keuls post-hoc analysis, *p<0.05, n=6 per treatment group. |