 |
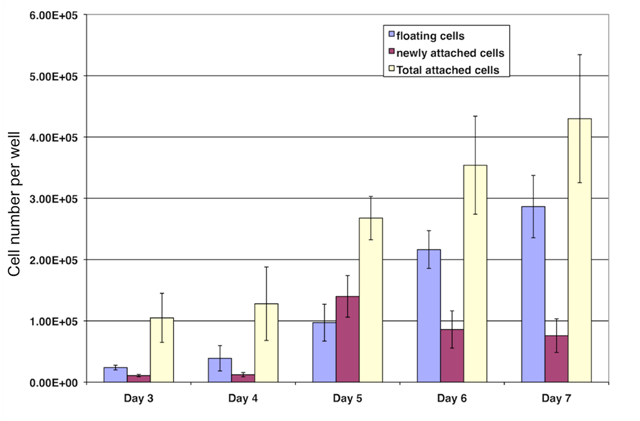
| Figure 1: The number of floating cells, attached cells and newly attached cells from Days 3-7 after passaging. From day 3 after passage, floating cells, attached cells were collected and counted and represented as mean cell number for each population. Bars represents mean cell number ± SEM. The cell attachment rate, increased from 10.7% at day 3 to 17.67 % (P< 0.05). The floating rate during the 24 h period was 2-4 times greater than the cell attachment rate on any given day, with the exception of Day 5. |