 |
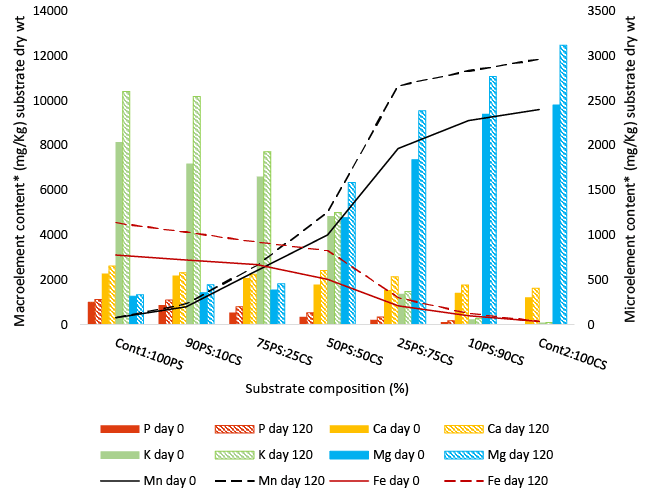
| Figure 3: Macroelement (bar chart) and Microelement (line graph) content of non-degraded (day 0) and degraded substrates (day 120) composed of peanut shell (PS) and cornstalks (CS). Solid state fermentation was carried out with Pleurotus ostreatus. Cont1-100PS and Cont2-100CS are controls composed of 100% peanut shells and 100% cornstalks respectively. Solid bars and lines represent non degraded substrates while patterned bars and broken lines represent degraded substrates. *Significant difference exists between macro- and micro-elements of 0 day (non-degraded) and 120 day (degraded) substrates. |