 |
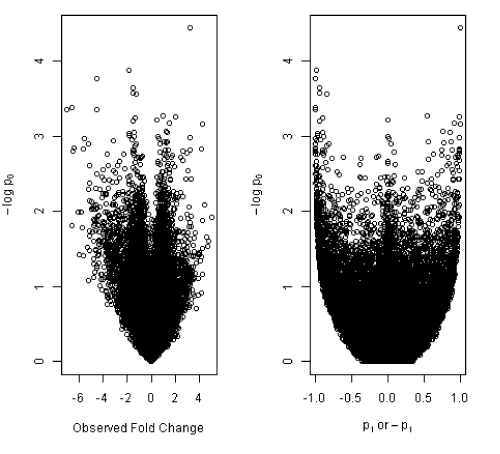
| Figure 4: Volcano plots showing the two perspectives of the balanced test separately: Classical volcano plot which graphs genes along dimensions of biological and statistical significance and a volcano plot where the p1- value on the x-axis, measure of evidence against the alternative Δ1, is signed according to the observed fold change. Most promising genes are genes that are present in the upper corners in both plots. |