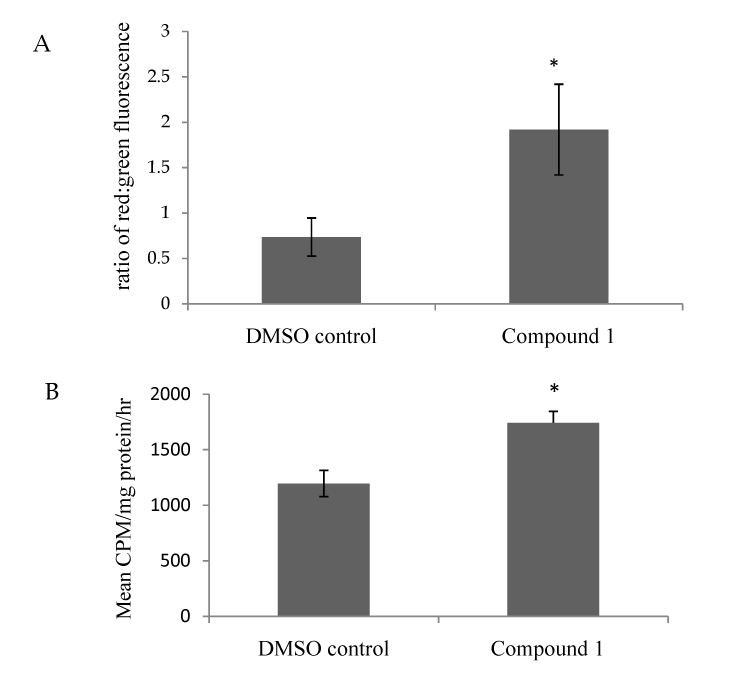
A: Mitochondrial membrane potential in HSMM treated with compound 1. Differentiated HSMM cells were treated with 250 μM of compound 1. Mitochondrial membrane potential was determined using the JC-1 assay. Results are expressed as ratio of red to green fluorescence of JC-1. Data is the average of three independent experiments, and represent means ± SD. P values were calculated using two sample, paired t test. *P=0.00000009 compound 1-treated cells versus DMSO-treated control cells.
B: Beta oxidation in C2C12 myotubules treated with compound 1. C2C12 myotubules were treated with DMSO or 200 μM of Compound 1. Beta oxidation assay was performed as described in the Research Methods and Procedures section. Results are expressed as counts per minute (CPM) per milligram (mg) of protein per hour (hr). Data is the average of three independent experiments, and represent means ± SD. P values were calculated using two sample, paired t test. *P=0.02 for compound 1 versus DMSO control cells.