 |
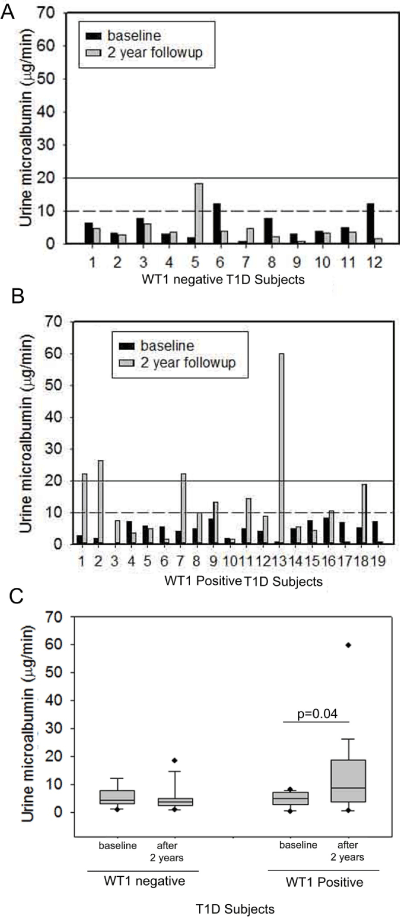
| Figure 2: Change in Urine Microalbumin levels in 2 year follow-up. Bar graphs showing urine microalbumin levels at baseline and at the end of 2 year follow-up, in type-1 diabetic subjects (T1D) with (A) undetectable WT1 (WT1 negative), and (B) detectable WT1 (WT1 positive) in urinary exosomes. Below is the box plot (C) comparing the changes in urine microalbumin levels between the two groups. The boxes indicate median and 25th and 75th percentiles; Outliers are indicated by closed dots. p<0.05 was considered significant by paired t-test. |