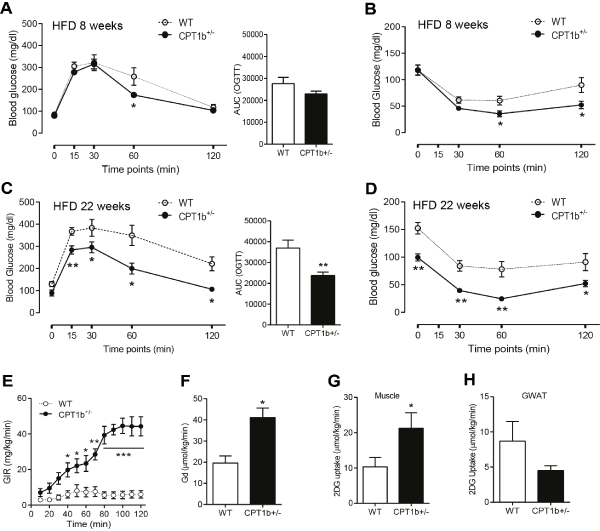
Insulin sensitivity was assessed by OGTT, ITT, and Insulin clamp study at different time points. (A) OGTT in mice with 8 weeks of HFD. (B) ITT in mice with 8 weeks of HFD. (C) OGTT in mice with 22 weeks of HFD. (D) ITT in mice with 22 weeks of HFD. Bar graphs are the area under curve (AUC) of OGTT calculated from the original graph. (E) Glucose infusion rate (GIR) during last 40 minutes of insulin-stimulated condition in mice with 22 weeks of HFD. (F) Whole body glucose disposal rate (Gd) in mice with 22 weeks of HFD. (G) Glucose uptake into gastrocnemius muscle in mice with 22 weeks of HFD. (H) Glucose uptake into GWAT in mice with 22 weeks of HFD. n=4-6, *p<0.05, **p<0.01, ***p<0.001.