 |
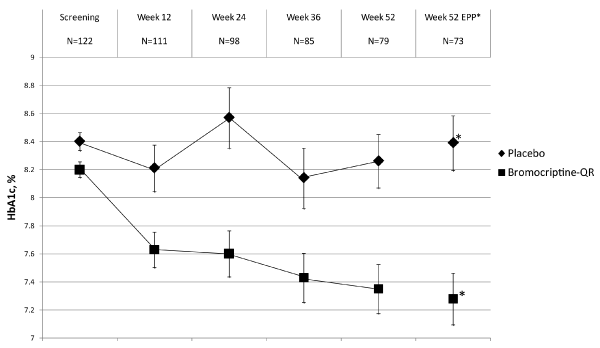
| Figure 1: Change over time in percent A1C by treatment group Among Subjects with a Baseline A1C of ≥ 7.5. The average A1C for subjects receiving bromocriptine-QR (squares) and placebo (diamonds) are depicted at each study visit for subjects that had an HbA1c measured. Overall there is a significant decline in A1C for those subjects randomized to bromocriptine- QR compared to no change after 52 weeks for those subjects randomized to placebo. EPP Analysis: Data represent those subjects completing 52 weeks of the study and being at least 80% compliant with prescribed dosing of study drug over the course of the trial. *The Week 52 EPP data point depicts the average A1C after adjusting for baseline hemoglobin a1c, age, race/ ethnicity, presence of concurrent oral antihyperglycemic medication, change of antihyperglycemic medication during follow-up, baseline rosiglitazone equivalent dose, and duration of diabetes mellitus. The between group difference for change from baseline in A1C for bromocriptine-QR versus placebo subjects was -0.91% (-1.47%, -0.35%; p = 0.002). |