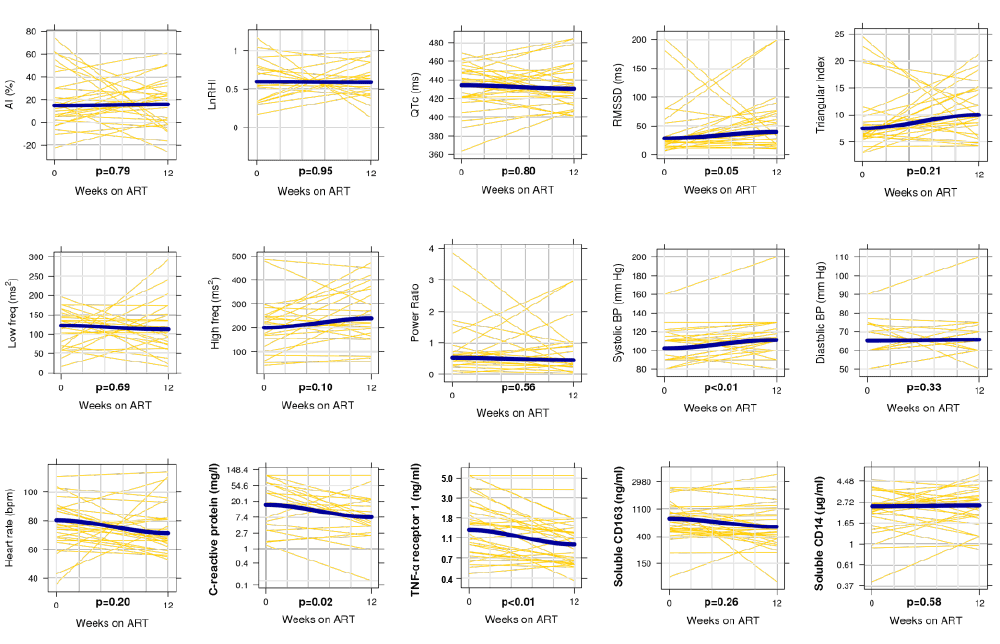
Yellow lines represent paired samples and blue lines represent smoothed (loess) curves fit to the data. As in the statistical models, the inflammation biomarkers are log-transformed and the cardiovascular markers are on the unit scale. Wilcoxon signed rank test was used to assess statistical significance.