 |
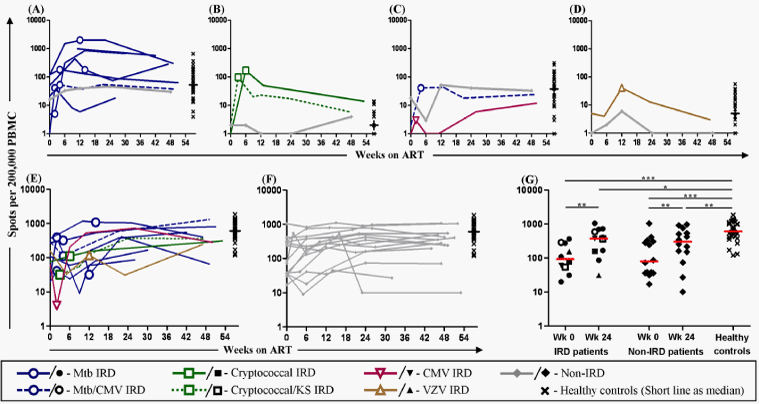
| Figure 1: ELISpot analysis of IFNγ-producing PBMC after stimulation with the following antigens: (A) PPD, (B) Cryptococcus neoformans mannoprotein, (C) CMV lysate and (D) VZV lysate. Median values for non-IRD patients at week 0, 6, 12, 24 and 48 are represented by filled symbols connected by a grey line in each graph. IFNγ production against a pan-NK cell target (K562 cells) in PBMC from HIV patients who experienced an IRD (E) and non-IRD patients (F). Cross-sectional comparison of IFNγ production against K562 cells between IRD patients, non-IRD patients and healthy controls (G). Horizontal lines represent median values. * = p<0.05, ** = p<0.01, *** = p<0.001. |