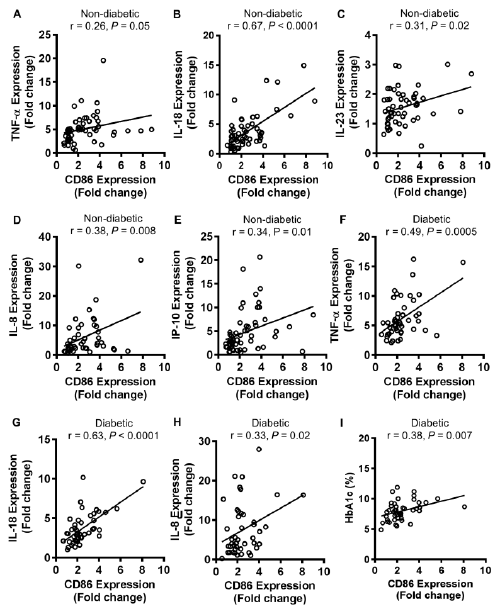
The adipose tissue gene expression of CD86 and signature inflammatory cyto-/chemokines (TNF-α, IL-18, IL-23, IL-8, and IP-10) was determined by quantitative real-time PCR as described in Methods. The mRNA expression of target gene with regard to average control expression (lean subjects) taken as 1 (fold change) was calculated by using Ct (2-ΔΔCt) method. The adipose tissue CD86 gene expression in non-diabetic individuals correlated positively with TNF-α (r = 0.26 P = 0.05) (A), IL-18 (r = 0.67 P < 0.0001) (B), IL-23 (r = 0.31 P = 0.02) (C), IL-8 (r = 0.38 P = 0.008) (D), and IP-10 (r = 0.34 P = 0.01) (E). CD86 gene expression in diabetic subjects correlated positively with TNF-α (r = 0.49 P = 0.0005) (F), IL-18 (r = 0.63 P < 0.0001) (G), IL-8 (r = 0.33 P = 0.02) (H), and glycated hemoglobin (HbA1c) (r = 0.38 P = 0.007) (I).