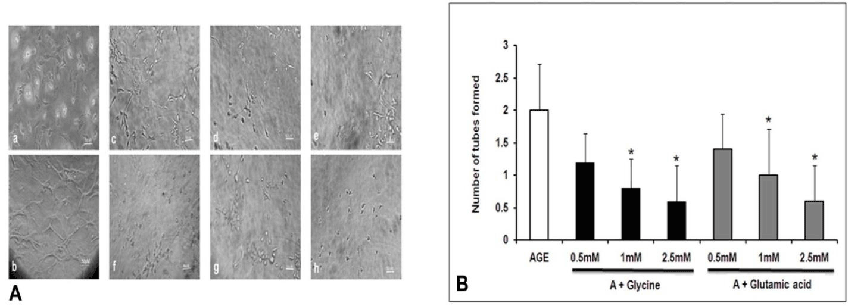
A; a: Control (untreated), b: AGE (100 μg/ml) treated cells c-e: Glycine+AGE (0.5, 1 and 2.5 mM), f-h: Glutamic acid+AGE (0.5, 1 and 2.5 mM).
B: Bar graph representing the tube formation in AGE and amino acid treated condition. Three different fields were counted and the number of tubes formed and inhibited was recorded. The mean ± SD values were plotted.