 |
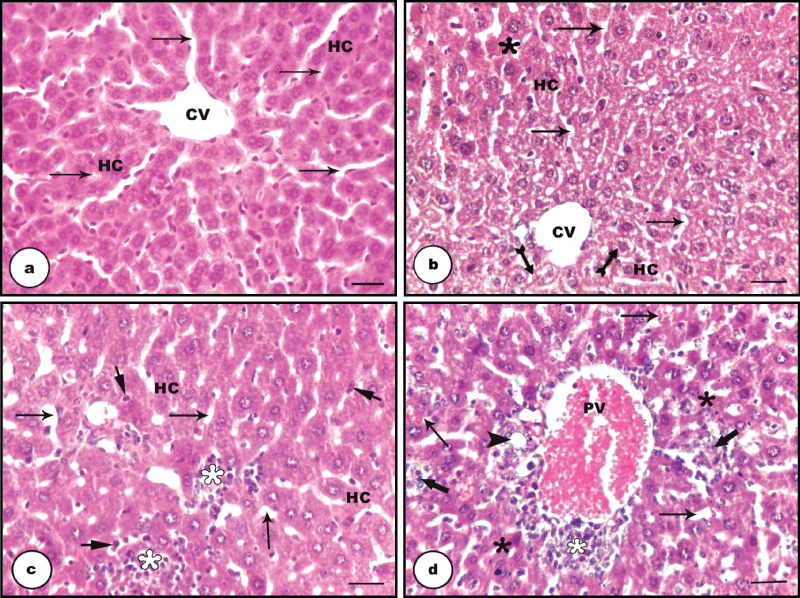
| Figure 1:a, photomicrograph of H&E stained section of liver from control mice showing central vein (CV) from which radiate the hepatic cords (HC) separated by hepatic sinusoids (arrows); b, photomicrograph of H&E stained hepatic section from mouse exposed to sodium arsenate displaying a central vein (CV) from which radiate the hepatic cords (HC) separated by dilated hepatic sinusoids (arrow) displaying less affected hepatocytes (asterisks) away from the CV and hepatocytes suffering from centrilobular hepatoxicity (forked tail arrows) next to CV; c, photomicrograph of H&E stained hepatic section from mouse exposed to sodium arsenate showing hepatic cords (HC) separated by dilated sinusoids (arrow) with proliferation of kupffer cells (long head arrow) and mononuclear leukocytic infiltration (white asterisks); d, photomicrograph of H&E stained hepatic section from mouse exposed to sodium arsenate exhibiting periportal mononuclear leukocytic infiltration (white asterisks), necrotic foci (thick arrows) and hyalinized hepatocytes (black asterisks) separated by congested hepatic sinusoids (arrow) surrounding severly congested portal vein(PV) and bile ductule (arrowhead). Scale bar = 30 μm. |