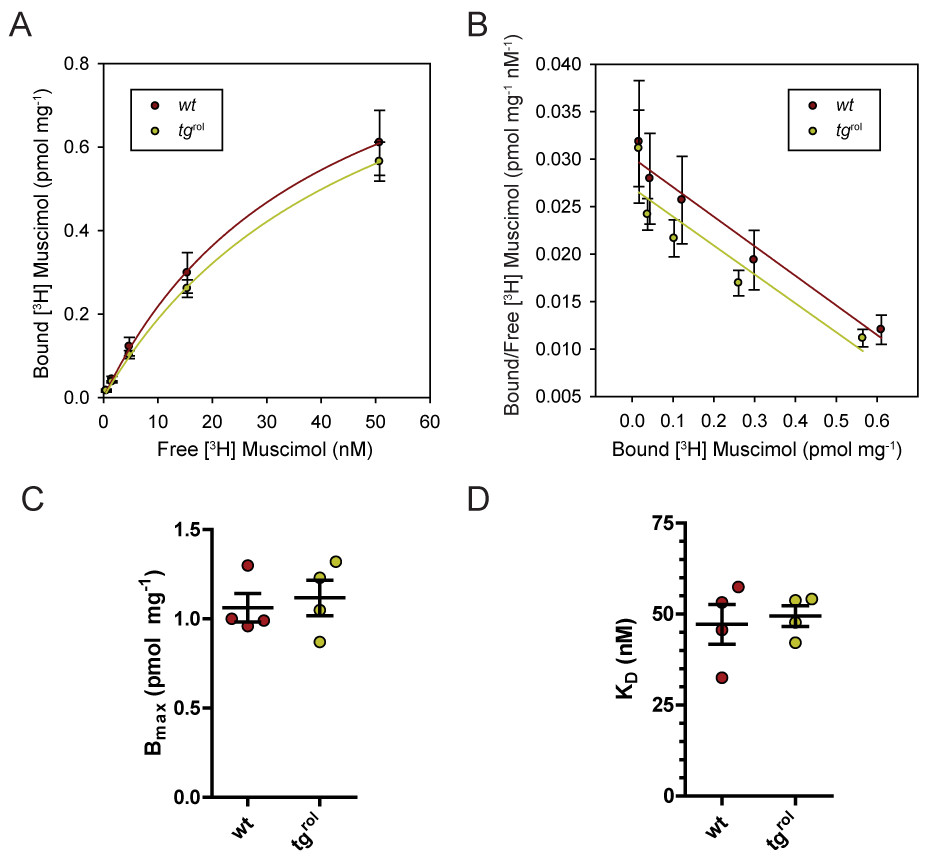
(A) [3H] Muscimol binding to wt and tgrol forebrain membrane homogenates was similar when fitted to a one-site binding curve.
(B) Rosenthal transformation was carried out and the Scatchard plot is shown.
(C) Bmax values were not statistically significant different between wt and tgrol. Individual values were obtained from fitting a binding curve against the forebrain sample of a single animal.
(D) Similarly, no differences in KD value were obtained.