Research Article Open Access
An On-card Approach for Assessment of Hematocrit on Dried Blood Spots which Allows for Correction of Sample Volume
John H Miller IV1, Philip A Poston2, Sarah C Rutan3 and Thomas Karnes H1*
1Department of Pharmaceutics, Virginia Commonwealth University Medical Center, USA
2Alere, Avee Laboratories, USA
3Department of Chemistry, Virginia Commonwealth, USA
- *Corresponding Author:
- Thomas Karnes H
Department of Pharmaceutics
Virginia Commonwealth University Medical Center
PO Box 980533, Richmond, VA 23298-0533, USA
Tel: 804-828-3819
Fax: 804-828-8359
E-mail: tom.karnes@vcu.edu, htkarnes@vcu.edu
Received date: January 09, 2013; Accepted date: February 18, 2013; Published date: February 26, 2013
Citation: Miller IV JH, Poston PA, Rutan SC, Thomas Karnes H (2013) An On-card Approach for Assessment of Hematocrit on Dried Blood Spots which Allows for Correction of Sample Volume. J Anal Bioanal Tech 4:162. doi: 10.4172/2155-9872.1000162
Copyright: © 2013 Miller IV JH, et al. This is an open-access article distributed under the terms of the Creative Commons Attribution License, which permits unrestricted use, distribution, and reproduction in any medium, provided the original author and source are credited.
Visit for more related articles at Journal of Analytical & Bioanalytical Techniques
Abstract
One of the biggest concerns with quantitative analysis of dried blood spots (DBS) is the uncertainty related to sample volume from a predefined punch. Blood with a high hematocrit will not diffuse as far as blood with a lower hematocrit when spotted on filter paper, resulting in differences in sample volume per unit area. Quantifying the hematocrit of blood would allow for correction of the sample volume, improving the quantitation in DBS analyses. Therefore, we have developed a novel approach using reflectance to measure hematocrit that will allow for sample volume correction. DBSs prepared at various levels of hematocrit from 25% to 75% were analyzed by UV-visible reflectance from 210 nm to 1000 nm using an Ocean Optics reflectance fiber optic probe. A linear correlation between the percent reflectance at 980 nm and hematocrit was found, with a correlation coefficient (r) of 0.9933. Quantitative analysis of sample volume was conducted by fortification of samples with known concentrations of acylcarnitines (Free carnitine, C2, C3, C4, C5, C6, C8, C10, C12, C14, C16 and C18). Analysis was carried out using LC/MS/MS on a Waters Premier triple quadrupole mass spectrometer. Hematocrit and sample volume showed a linear relationship with a correlation coefficient (r) of 0.9929. We validated our model using donor samples at various levels of hematocrit by first analyzing the samples by NIR reflectance to determine hematocrit and then correcting for sample volume. Our results showed improved quantitation of various donor samples with accuracies between 81% and 115% compared to not correcting for sample volume, which showed accuracies from 67% to 136%. This is the first on-card approach used to determine sample hematocrit allowing for improved quantitation by correcting sample volume. In addition, the reflectance format used allows for direct, automatable volume corrections on the card, without the need for off-line procedures to test whole blood.
Keywords
Hematocrit; Dried blood spots; Acylcarnitines
Introduction
Analysis of dried blood spots (DBS) has been used in newborn screening for decades, and more recently, it has become increasingly applied in analysis of pharmaceuticals for new drug development and for therapeutic drug monitoring [1-3]. This sample collection technique offers many advantages including minimal sample collection volume, reduced costs associated with shipping and storage; it is less invasive than collecting venous samples and minimizes risks associated with transmission of some infectious diseases such as HIV [4,5]. Despite the numerous advantages of this sample collection technique, the most common concern is how to correct for sample volume. Hematocrit, which is a measure of concentration of red blood cells per unit volume of blood, has the largest influence on the sample volume of a fixed punch size for DBS analysis. This is primarily due to the viscosity of blood being greater at high hematocrit and less at low hematocrit [3]. When blood is applied to filter paper, the blood will diffuse at different rates for low and high hematocrits, affecting the size of the blood spot [2,3,6,7]. Since a fixed punch size is used for sample analysis, the sample size is dependent on hematocrit, and it can be significantly different in cases of abnormally low and high hematocrit [2,7]. Typical hematocrit for healthy adults ranges from 28-67%, and the normal range for healthy newborns is from 42-64% [2]. However, abnormal hematocrit can be characteristic of polycythemia or anemias, causing extremely high and low hematocrit respectively. Several publications have reported the effects of hematocrit on the calculated concentrations of pharmaceuticals [2,8], amino acids and acylcarnitines [9] in DBSs. In addition, some compounds show a chromatographic effect, where the concentration of the analyte is higher in a center punch relative to a peripheral punch [1,9]. Others have reported only minimal differences in sample volume for blood within the normal hematocrit range when 15 μL of blood was spotted on filter paper [2]. However, unless a predefined volume of blood is spotted on filter paper and the whole spot is analyzed, it is difficult to accurately quantify sample volume. Edelbroek has reviewed several publications using a predefined volume, and it appears to help eliminate hematocrit differences [3]. Although spotting an exact volume of blood and taking the entire spot may work for clinical analysis or therapeutic drug monitoring, it is not practical for new born screening.
New born screening relies on a simplistic approach of spotting whole blood from a heal puncture on the filter paper, and the sample volume is approximated at 3.1 μL from a 3 mm punch [9]. In most cases the identification of a specific disorder is fairly discriminate; however, there are times when correction for volume could mean the difference between a positive and a negative test result [9,10]. Routine DBS analysis has been shown to be acceptable for newborn screening for decades, but there is still the potential to further improve the positive predictive value of this test. Since cut-off values are set independent of the hematocrit value, the potential to misidentify samples is increased with high or low hematocrit samples. It has been reported that the sample volume in DBS analysis can vary by as much as 47%, depending on the hematocrit [7]. A recent study evaluated the effect hematocrit has on the estimated concentration of succinylacetone, which showed that samples with low hematocrit quantified approximately 45% low, and samples with high hematocrit quantified 24% higher than expected [11]. Hematocrit effects on the analysis of amino acids and acylcarnitnes was reported by Holub, who showed a positive correlation between analyte concentration and hematocrit [9]. Holub also reported a chromatographic effect for some of these analytes, which had significant differences in concentration between peripheral and center punches [9]. There have been attempts in newborn screening to correct sample volume for differences in hematocrit using hemoglobin variant testing to approximate the sample volume [10]. Orsini reported an average accuracy of 108% using hemoglobin concentration to approximate sample volume, however the results ranged from 73.5% to 142% [10]. We are suggesting an alternative approach to relate UV/NIR reflectance to hematocrit that will allow for volume correction.
UV-visible and NIR spectroscopies have been used for years to evaluate the composition and properties of blood in vitro and in vivo [12-20]. Several models and theories have been used to explain the light scattering, absorption and reflectance properties of whole blood to determine hemoglobin concentration, hematocrit and blood oxygenation levels. Many of these theoretical models have resulted in medical devices used by health care providers, including oximeters [14,17] and hemoglobinometers [19]. Reflectance devices offer several major advantages over other sampling techniques including nondestructive analysis, less invasive sampling, portable instrumentation and faster analysis time. Although there are many spectroscopic methods used for hematocrit determination for whole blood in vivo and in vitro, there have not been any published articles related to the spectroscopic analysis of DBSs to determine hematocrit.
We have developed a novel on-card approach to evaluate hematocrit on DBSs using diffuse reflectance. Our method is the first reported direct sampling approach to relate UV/NIR reflectance to hematocrit. Hematocrit can be used to correct for sample volume variations in excised spots, improving precision and accuracy for DBS analysis. A reflectance technique could be adopted by newborn screening or clinical laboratories to correct sample volume on the DBS card at the time of analysis which may improve quantification. Results are presented for quantitative analysis of acylcarnitines in DBSs from donor samples at various hematocrit levels.
Materials and Methods
Materials and reagents
Acylcarnitine reference standards were purchased from VU Medical Center Metabolic Laboratory, (Amsterdam, The Netherlands). Stable isotope labeled acylcarnitines reference materials were obtained from Cambridge Isotopes (Andover, MA, USA). HPLC grade acetonitrile, formic acid and ammonium formate were from Fisher Scientific (Pittsburgh, PA, USA). Control human potassium EDTA whole blood was obtained from Biochemed (Winchester, VA, USA). Newborn screening cards, 903 Protein Saver and DMPK filter paper cards were obtained from Whatman (Piscataway, NJ, USA).
Chromatographic instrumentation
Chromatographic separations were conducted with a Waters Acquity HILIC Amide column (2.1×50 mm, 1.7 μm) Waters Corp., (Milford, MA, USA). A Waters Acquity UPLC pump and sample manager were used for gradient separation and analysis. A Waters Premier triple quadrupole mass spectrometer (Milford, MA, USA) equipped with Electrospray Ionization (ESI) source in positive ion mode was used for detection. Instrument parameters were optimized for analysis of acylcarnitines and their labeled internal standards by direct infusion of an external standard solution into the mass spectrometer. Optimal sensitivity was achieved using 3.8 kV for the capillary voltage, 390°C for the desolvation temperature, with nitrogen as the desolvation gas at a flow rate of 800 L/hr. The cone gas was nitrogen at a flow rate of 20 L/hr, with a source temperature of 110°C. Argon was used for the collision gas at a flow rate of 0.4 L/hr. Multiple Reaction Monitoring (MRM) was used for all analytes and internal standards. Samples were analyzed for acylcarnitines using a HILIC Amide (2.1×50 mm, 1.7 μm) column at a flow rate of 0.3 mL/minute. Compounds were eluted using a gradient elution form 95% B to 55% B over 3 minutes with 90:10 acetonitrile/10 mM ammonium acetate for mobile phase B and 0.1% formic acid in water for mobile phase A. The individual mass transitions for all analytes are shown in table 1. Optimized MRMs were used based on the retention time of analytes to achieve a minimum 0.4 minute window around each peak with a 0.02 second dwell time and a 0.02 second inter-scan delay.
| Analyte | ID | CV (V) | CE (eV) | MRM Transition | I.S. | I.S. MRM Transition | Time segment (min) |
|---|---|---|---|---|---|---|---|
| Carnitine | C0 | 22 | 20 | 161.9→84.6 | C0-D9 | 170.9→84.6 | 1.73 to 2.03 |
| Acetylcarnitine | C2 | 22 | 20 | 203.9→84.6 | C2-D3 | 206.9→84.6 | 1.57 to 1.87 |
| Propionylcarnitine | C3 | 22 | 20 | 217.9→84.6 | C3-D3 | 220.9→84.6 | 1.43 to 1.73 |
| Butyrylcarnitine | C4 | 22 | 21 | 231.9→84.6 | C4-D3 | 235.0→84.6 | 1.31 to 1.61 |
| Valerylcarnitine | C5 | 22 | 23 | 246.0→84.6 | C5-D9 | 255.1→84.6 | 1.21 to 1.51 |
| Hexanoylcarnitine | C6 | 22 | 23 | 260.0→84.6 | C8-D3 | 291.1→84.6 | 1.10 to 1.40 |
| Octanoylcarnitine | C8 | 22 | 23 | 288.1→84.6 | C8-D3 | 291.1→84.6 | 0.97 to 1.27 |
| Decanoylcarnitine | C10 | 22 | 28 | 316.1→84.6 | C8-D3 | 291.1→84.6 | 0.80 to 1.10 |
| Lauroylcarnitine | C12 | 22 | 28 | 344.1→84.6 | C14-D9 | 381.2→84.6 | 0.63 to 1.01 |
| Myristoylcarnitine | C14 | 22 | 28 | 372.1→84.6 | C14-D9 | 381.2→84.6 | 0.63 to 1.01 |
| Palmitoylcarnitine | C16 | 22 | 28 | 400.2→84.6 | C16-D3 | 403.2→84.6 | 0.00 to 0.95 |
| Stearoylcarnitine | C18 | 22 | 28 | 428.2→84.6 | C16-D3 | 403.2→84.6 | 0.00 to 0.95 |
Table 1: Acylcarnitines and amino acids analyzed and the mass spectral settings for MRM mode.
UV-visible-instrumentation
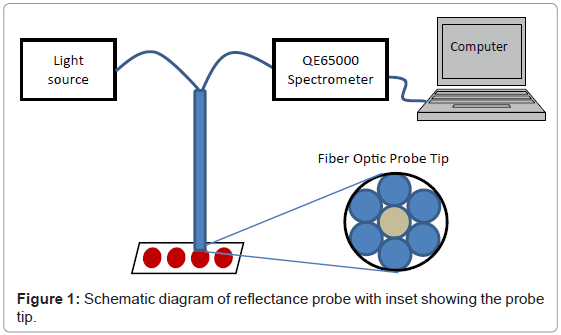
DBS samples were analyzed with a QE65000 Scientific-Grade Spectrometer and deuterium tungsten halogen light source from Ocean Optics (Dunedin, FL). Reflectance measurements were made with a R400-7-VIS/NIR reflectance probe, Ocean Optics. Data was collected from 200-1000 nm using a 6 msec integration time and a boxcar smooth setting of 2 points. The reflectance probe was held in position using a gripper mounted to a ring stand. An adjustable stage was placed below the probe to adjust the height of the probe to determine the optimal distance between the probe and the sample. Following the optimization experiment, the adjustable stage was removed and the probe was fixed at the optimized distance from the base in order to make optical measurements more consistent. A schematic of the reflectance probe apparatus is shown in figure 1.
Preparation of DBSs
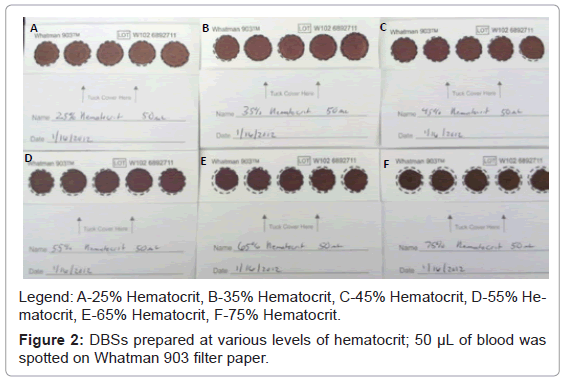
Potassium EDTA human whole blood was used to prepare samples at 25%, 35%, 45%, 55%, 65% and 75% hematocrit. The hematocrit was measured by centrifuging the samples at 3500 rpm for 20 minutes and measuring the volume of red blood cells. The hematocrit was adjusted by adding or removing serum. The red blood cells were then re-suspended by gentle mixing. For quantitative purposes, individually prepared reference standards containing acylcarnitines (carnitine, C2, C3, C4, C5, C6, C8, C10, C12, C14, C16 and C18) were fortified into the whole blood at approximately ten times the endogenous level. After thoroughly mixing the samples, 50 μL of unfortified and fortified whole blood samples at the various levels of hematocrit were spotted on three different lots of Whatman 903 Protein Saver newborn screening cards. For DMPK filter paper cards only 15 μL of blood was spotted on filter paper due to limitation in volume for these cards. In addition, 10 μL, 25 μL and 100 μL of the same samples were spotted on separate Whatman 903 filter paper cards. All samples were allowed to thoroughly dry at room temperature and then stored at 0-5°C until analyzed. Figure 2 is a picture of DBSs after drying, with hematocrit values ranging 25% to 75%. There are some distinct differences observed in the DBSs at the various hematocrit levels. Samples prepared at 25% and 35% hematocrit appear to have a second lighter ring that diffuses out farther from the center. As the hematocrit level increases to about 45% this ring becomes less apparent. Samples prepared at 65% and 75% hematocrit appear much darker in color and do not fill the entire spot with 50 μL of blood.
Results and Discussion
UV-visible reflectance of DBSs
UV-visible reference measurements were made by taking ambient measurements in which the light source was blocked. Whatman 903 filter paper was used for the spectral background measurement. For our initial investigations we collected both absorbance and reflectance data when the probe was positioned perpendicular to the DBS samples. There were some similarities between reflectance and absorbance spectra however the absorbance spectra is the inverse log of reflectance signal. Since we are measuring diffuse reflectance which is a measure of both light scattering and absorption, we decided to collect the data in the reflectance mode.
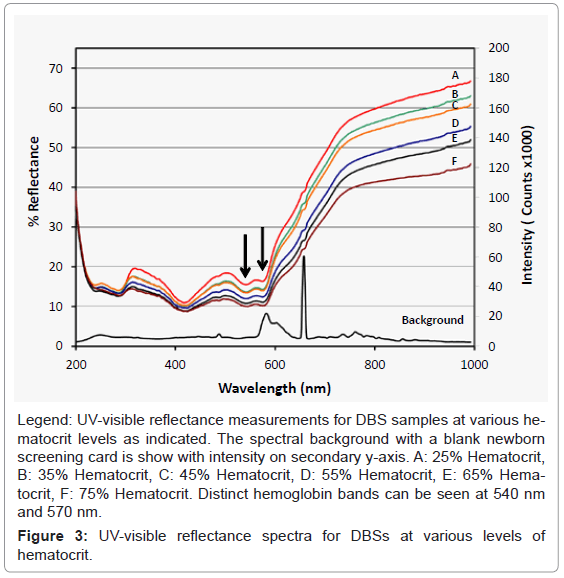
We considered using the hemoglobin bands at 540 and/or 570 nm for the basis of the analysis; these bands are indicated by the arrows in figure 3. We found that there was not a consistent relationship between the signal intensity of the hemoglobin bands and the hematocrit of the samples. However the scattering background, especially at longer wavelengths, seemed to correlate well with the hematocrit values, and we optimized the analysis based on this observation.
Probe height optimization
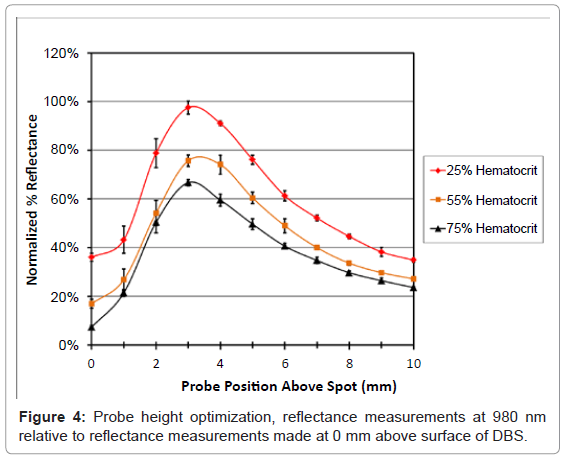
Reflectance is related to the intensity of the light therefore it was important to optimize the probe position above the sample to achieve the highest response. The probe height was optimized by measuring the reflectance from 200 to 1000 nm for 25%, 55% and 75% hematocrit DBS samples. The position of the probe was adjusted from 0 mm to 10mm from the surface of the spot in 1 mm increments by raising and lowering an adjustable stage. Triplicate analyses of each sample were performed at different locations for each hematocrit at 25%, 55% and 75%. Reflectance measurements were evaluated for several different wavelengths from 200 to 1000 nm. There appeared to be similarities in the intensity plots, however wavelengths above 800 nm had the highest intensities. Data is reported for 980 nm to show the relationship between intensity and probe position for the different samples (Figure 4).
From these data it was apparent that positioning the probe 3-4 mm above the surface of the paper provided the highest relative intensity for each hematocrit level. At positions lower than 3 mm the reflectance for 55% and 75% hematocrit were not significantly different. Measurements above 4 mm had lower intensity which was probably due to the inefficient light collection caused by moving the probe farther away from the samples. Both 3 and 4 mm provided adequate differentiation between the hematocrit levels, and both had the same correlation coefficient of 0.983 and a slope of -1.00 (± 0.07), data not shown. In order to standardize the settings the probe height was set to 4 mm for all additional experiments.
UV-visible reflectance analysis of control samples
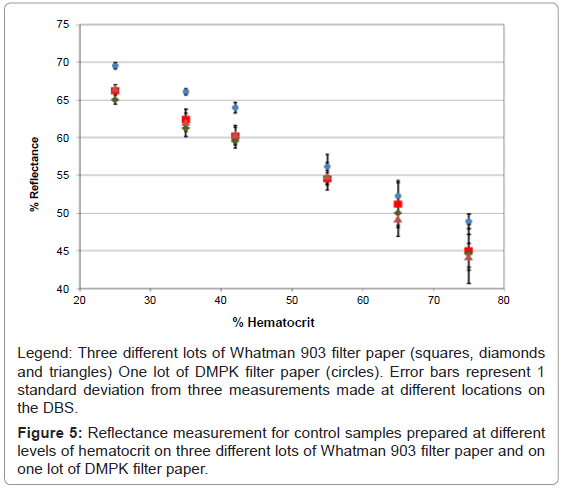
Reflectance measurements were made for control samples prepared at 25%, 35%, 45%, 55%, 65% and 75% hematocrit. Samples were analyzed in triplicate at different positions on a DBS. In addition three different lots of Whatman 903 filter paper and one lot of DMPK filter paper were analyzed. Reflectance spectra from 200 nm to 1000 nm were collected for each sample in triplicate at different locations on each DBS, figure 3. The reflectance measurements for samples with different hematocrits have some distinct features as referenced by Serebrennikova [15]. Also, there were two distinct bands at 540 nm and 570 nm which have been previously reported as the characteristic hemoglobin bands [20]. Figure 3 also provides the absorbance spectra of a blank filter paper sample to show the background regions that could interfere with the reflectance measurements. The region above 800 nm has the cleanest background and provides a good relationship between hematocrit and reflectance.
Data analysis of the reflectance spectra was performed by extracting percent reflectance at different wavelengths and plotting the signal response versus percent hematocrit. Several wavelengths provided a linear correlation between percent hematocrit and hemoglobin; however, 980 nm had the best correlation coefficient and the largest slope, therefore this wavelength was chosen for further measurements. DBSs prepared at various levels of hematocrit were evaluated on two additional lots of Whatman 903 filter paper and one lot of DMPK filter paper cards. Linear relationships with correlation coefficients greater than 0.9900 were observed all data sets, however there appeared to be slight differences between the reflectance response for samples prepared with DMPK filter paper and the Whatman 903 filter paper (Figure 5). This difference may be due to the fact that the volume of blood spotted on the DMPK filter paper cards was only 15 μL, while the volume of blood spotted on the Whatman 903 filter paper cards was 50 μL. It has been previously reported that volume of blood spotted on filter paper affects the volume of sample analyzed from a 6 mm punch [7].
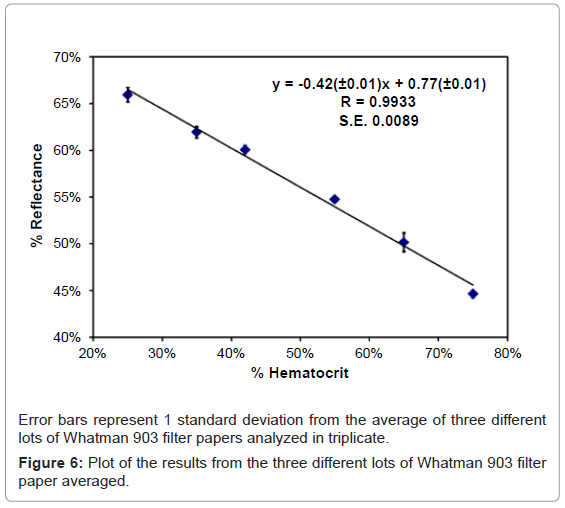
The average response for each hematocrit level on the three different lots of Whatman 903 filter paper was used for our model. A linear model with a slope of -0.42 (± 0.01) and a y-intercept of 0.77 (± 0.01) was achieved between reflectance and hematocrit with an overall average correlation coefficient 0.9933 with a standard error of regression of 0.0089. This model was used to calculate the percent hematocrit for donor samples at low, normal and high hematocrit levels. Each DBS was analyzed in triplicate at different positions to test intra spot variability. Reflectance data was collected for each sample from 200 nm to 1000 nm for each sample. The response at 980 nm was used to calculate the hematocrit level using the equation shown in figure 6. Results from this experiment are presented in table 2, along with the predetermined hematocrit levels and the percent difference between the measured and predetermined values. The overall hematocrit determined using reflectance was within ± 11% (4% in terms of hematocrit units) of the predetermined value. In addition, the overall percent relative standard deviations for three replicate measurements at three hematocrit levels were also within 11%. Overall this technique was successful at quantifying the hematocrit level on DBSs for donor samples.
| Low Level | Donor 1 | Donor 2 | Donor 3 | Donor 4 | Donor 5 | Donor 6 |
|---|---|---|---|---|---|---|
| Rep 1 | 32 | 35 | 39 | 24 | 30 | 24 |
| Rep 2 | 28 | 33 | 39 | 25 | 32 | 24 |
| Rep 3 | 32 | 34 | 42 | 23 | 34 | 24 |
| Mean | 31 | 34 | 40 | 24 | 32 | 24 |
| S.D. | 2 | 1 | 2 | 1 | 2 | 0 |
| %RSD | 7% | 4% | 5% | 5% | 6% | 1% |
| Measured Hematocrit | 29 | 34 | 36 | 25 | 32 | 27 |
| % Difference from Measured | 6% | 0% | 11% | -6% | 0% | -11% |
| Normal Level | Donor 1 | Donor 2 | Donor 3 | Donor 4 | Donor 5 | Donor 6 |
| Rep 1 | 49 | 52 | 50 | 39 | 47 | 37 |
| Rep 2 | 49 | 49 | 48 | 38 | 45 | 38 |
| Rep 3 | 48 | 54 | 52 | 41 | 50 | 35 |
| Mean | 49 | 51 | 50 | 39 | 47 | 36 |
| S.D. | 0 | 2 | 2 | 2 | 2 | 1 |
| %RSD | 1% | 5% | 4% | 4% | 5% | 4% |
| Measured % Hematocrit | 46 | 51 | 50 | 38 | 48 | 41 |
| % Difference from Measured | 6% | 1% | 0% | 4% | -2% | -11% |
| High Level | Donor 1 | Donor 2 | Donor 3 | Donor 4 | Donor 5 | Donor 6 |
| Rep 1 | 76 | 64 | 71 | 65 | 58 | 69 |
| Rep 2 | 69 | 73 | 73 | 70 | 68 | 67 |
| Rep 3 | 64 | 79 | 68 | 64 | 59 | 61 |
| Mean | 69 | 72 | 70 | 66 | 62 | 66 |
| S.D. | 6 | 8 | 3 | 3 | 6 | 4 |
| %RSD | 9% | 11% | 4% | 5% | 9% | 6% |
| Measured % Hematocrit | 66 | 71 | 71 | 68 | 67 | 68 |
| % Difference from Measured | 5% | 0% | -1% | -3% | -8% | -4% |
Table 2: Determination of hematocrit for donor samples using reflectance at 980 nm.
Evaluation of the effect of sample volume on reflectance
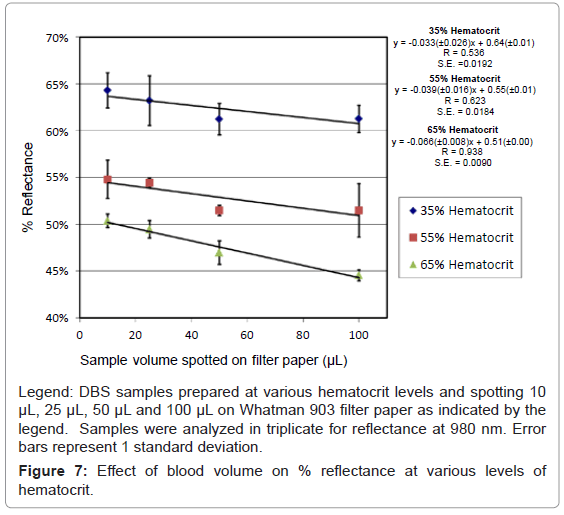
The volume of blood spotted has also been shown to affect the sample size [7]. When spotting small volumes (15 μL) of blood the percent hematocrit has been shown to have less effect on sample size [2]. However, it has been previously reported that the sample volume within a punch can increase by as much as 15% between 25 μL of blood spotted and 125 μL of blood spotted on filter paper [7]. Therefore we decided to investigate the reflectance measurement for samples that were prepared with different volumes of blood. Samples prepared with 10 μL, 25 μL 50 μL and 100 μL at 35%, 55% and 65% hematocrit were analyzed using reflectance at 980 nm. Samples were analyzed in triplicate for each volume and hematocrit level at various positions on DBSs; the results are shown in figure 7.
It is apparent from figure 7 that as the volume of sample spotted on the filter paper increases there is a decrease in the percent reflectance. Also the decrease in reflectance is not consistent from 35% hematocrit to 65% hematocrit, as shown by the slope of the lines -0.033 (± 0.26) and -0.066 (± 0.008) respectively. Samples prepared with 65% hematocrit showed the largest decrease in reflectance as the volume of blood spotted increased from 10 μL to 100 μL. Using just reflectance alone, it would not be possible to distinguish between a 10 μL sample with a 65% hematocrit spotted and 100 μL sample with a 55% hematocrit. However, 50-100 μL of blood spotted shows significant differences between 35%, 55% and 65%. The manufacturer indicates that the amount of blood that will fill the circular region on a Whatman 903 filter paper is between 75 to 100 μL of blood. Also for newborn screening the circular spot should be completely filled, which would be equivalent to 75-100 μL. Therefore inconsistent results at low volume should not be a problem if the sample is collected properly.
Quantitative Analysis
Quantitative analysis of control samples to determine sample volume
Quantitative analysis of the DBSs was used to evaluate the relationship between sample volume and hematocrit. There have been others that have evaluated this relationship off line for selected pharmaceutical compounds and for amino acids and acylcarnitines for DBSs at various hematocrit levels [2,8,9]. We are reporting data for a wider range of hematocrit than previously reported and with multiple lots of Whatman 903 filter paper. For this experiment, a 3 mm punch from DBSs was extracted in 0.100 mL of a mixture of 90:10 acetonitrile/water with 10 mM ammonium formate with labeled internal standards. Samples were analyzed by LC/MS/MS and quantified using a calibration curve prepared in 90:10 acetonitrile/10 mM ammonium formate containing carnitine, C2, C3, C4, C5, C6, C8, C10, C12, C14, C16, C18 and their labeled internal standards.
DBS samples from each of the three lots of Whatman 903 filter paper were analyzed in triplicate at each hematocrit level from 25% to 75%. Back calculated values for each analyte were determined using the external calibration curve (‘Calculated Concentration’). The volume of the sample was determined based on the fortified level and back calculated concentration using the following equation:

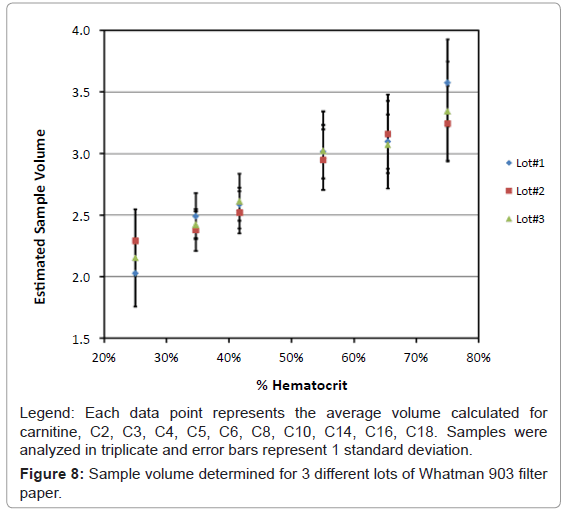
Equation 1: Sample volume was calculated for each analyte, carnitine, C2, C3, C4, C5, C6, C8, C10, C12, C14, C16 and C18. There were some differences observed in the sample volume when calculated using different analytes, however the overall differences were less than 10%. The volume for each hematocrit level was calculated by averaging the result for volume from all the analytes. The overall % relative standard deviations were less than 10%. Results for the average volume versus hematocrit were determined with three lots of Whatman 903 filter paper and are shown in figure 8.
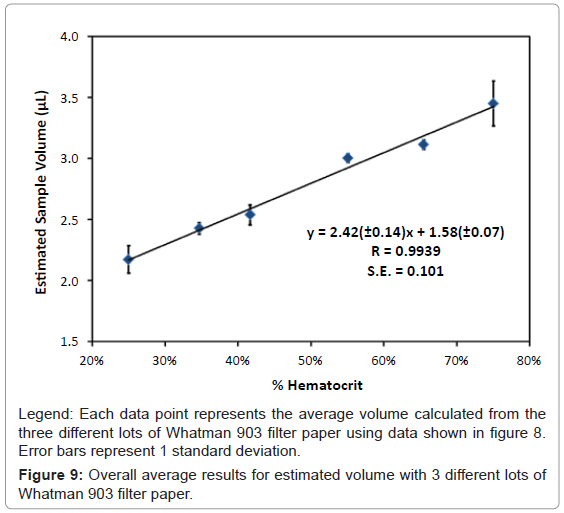
It was apparent from our results that as the percent hematocrit increases, there is approximately a 55% increase in the perceived sample volume from 25% hematocrit to 75% hematocrit. The three different lots of Whatman 903 filter paper cards showed consistent results for each of the different hematocrit levels. The overall average from the three different lots of Whatman 903 filter paper was used to determine the average volume for each hematocrit level. A linear correlation with a slope of 2.42 (± 0.14), a y-intercept of 1.58 (± 0.07) with a correlation coefficient (r) of 0.9939 and a standard error of 0.101 was obtained, figure 9. This curve was used to determine sample volume of the donor samples based on the hematocrit determine from the reflectance measurements.
Quantitative analysis of donor samples
Eighteen donor samples at high, normal and low hematocrit levels fortified with known concentrations of acylcarnitines were extracted using the same conditions as described earlier. Back calculated concentrations were determined for each acylcarnitine, carnitine, C2, C3, C4, C5, C6, C8, C10, C12, C14, C16 and C18 using response ratios with labeled internal standards. The values for hematocrit determined from the reflectance measurements in table 2 were then used to determine sample volume for each donor based on the relationship determined in figure 9. The calculated value using the volume correction was compared with the fortified level to determine accuracy and the results are reported in table 3. The average accuracy for individual acylcarnitines in the low hematocrit samples ranged from 97% to 114%, for an overall accuracy of 103% ± 5%. The average accuracy for individual acylcarnitines in the high hematocrit samples ranged from 81% to 115% for an overall accuracy of 98% ± 8%.
| Donor | C0 | C2 | C3 | C4 | C5 | C6 | C8 | C10 | C12 | C14 | C16 | C18 |
| 1 | 111% | 97% | 92% | 104% | 101% | 98% | 103% | 98% | 97% | 108% | 102% | 104% |
| 2 | 111% | 107% | 96% | 102% | 98% | 96% | 100% | 96% | 97% | 101% | 102% | 104% |
| 3 | 113% | 106% | 99% | 102% | 101% | 99% | 105% | 97% | 106% | 107% | 106% | 103% |
| 4 | 112% | 117% | 100% | 102% | 98% | 93% | 99% | 101% | 105% | 108% | 108% | 111% |
| 5 | 119% | 111% | 105% | 106% | 104% | 95% | 105% | 98% | 103% | 110% | 110% | 111% |
| 6 | 118% | 83% | 94% | 107% | 103% | 99% | 105% | 104% | 104% | 112% | 109% | 109% |
| Mean | 114% | 104% | 98% | 104% | 101% | 97% | 103% | 99% | 102% | 108% | 106% | 107% |
| S.D. | 3.6% | 11.7% | 4.7% | 2.2% | 2.4% | 2.4% | 2.9% | 2.8% | 4.1% | 3.7% | 3.4% | 3.9% |
| %RSD | 3.1% | 11.3% | 4.8% | 2.1% | 2.3% | 2.5% | 2.8% | 2.9% | 4.0% | 3.4% | 3.2% | 3.6% |
| Overall | 103% | |||||||||||
| Donor Samples at Normal Level Hematocrit | ||||||||||||
| Donor | C0 | C2 | C3 | C4 | C5 | C6 | C8 | C10 | C12 | C14 | C16 | C18 |
| 1 | 94% | 102% | 101% | 102% | 96% | 94% | 97% | 89% | 94% | 101% | 93% | 93% |
| 2 | 89% | 105% | 93% | 90% | 89% | 84% | 88% | 78% | 86% | 87% | 88% | 89% |
| 3 | 102% | 114% | 105% | 99% | 98% | 98% | 103% | 93% | 104% | 102% | 105% | 102% |
| 4 | 115% | 97% | 99% | 95% | 94% | 97% | 121% | 105% | 108% | 106% | 108% | 102% |
| 5 | 100% | 115% | 105% | 106% | 100% | 99% | 101% | 94% | 108% | 105% | 105% | 104% |
| 6 | 94% | 98% | 93% | 100% | 96% | 90% | 94% | 94% | 98% | 101% | 97% | 98% |
| Mean | 99% | 105% | 99% | 99% | 96% | 94% | 101% | 92% | 100% | 100% | 99% | 98% |
| S.D. | 8.8% | 7.7% | 5.3% | 5.7% | 3.9% | 5.7% | 11.1% | 8.8% | 8.8% | 6.9% | 7.8% | 5.6% |
| %RSD | 8.9% | 7.3% | 5.4% | 5.8% | 4.1% | 6.0% | 11.0% | 9.5% | 8.8% | 6.8% | 7.9% | 5.7% |
| Overall | 98% | |||||||||||
| Donor Samples at High Level Hematocrit | ||||||||||||
| Donor | C0 | C2 | C3 | C4 | C5 | C6 | C8 | C10 | C12 | C14 | C16 | C18 |
| 1 | 77% | 111% | 101% | 97% | 97% | 98% | 101% | 91% | 105% | 102% | 95% | 92% |
| 2 | 79% | 112% | 99% | 94% | 94% | 88% | 93% | 83% | 94% | 89% | 87% | 84% |
| 3 | 84% | 115% | 106% | 101% | 97% | 95% | 102% | 95% | 105% | 100% | 96% | 90% |
| 4 | 83% | 123% | 108% | 104% | 102% | 96% | 104% | 91% | 107% | 102% | 105% | 100% |
| 5 | 85% | 118% | 114% | 116% | 107% | 101% | 107% | 99% | 104% | 105% | 97% | 92% |
| 6 | 76% | 108% | 103% | 110% | 106% | 103% | 102% | 91% | 98% | 91% | 90% | 86% |
| Mean | 81% | 115% | 105% | 104% | 100% | 97% | 102% | 92% | 102% | 98% | 95% | 91% |
| S.D. | 4.0% | 5.5% | 5.5% | 8.3% | 5.4% | 5.1% | 4.9% | 5.2% | 4.8% | 6.4% | 6.0% | 5.8% |
| %RSD | 4.9% | 4.8% | 5.3% | 8.0% | 5.4% | 5.3% | 4.8% | 5.7% | 4.7% | 6.6% | 6.4% | 6.3% |
| Overall | 98% | |||||||||||
Table 3: Calculation of % accuracy for acylcarnitines in 6 donor samples at low, normal and high hematocrit Samples corrected for volume using reflectance measurements.
The same samples were also quantified using an assumed volume of 3.1 μL for all samples, independent of hematocrit, which is the current approach used in newborn screening. Table 4 shows the calculated accuracy for the same samples assuming the volume was 3.1 μL. The average accuracy for individual acylcarnitines in the low hematocrit samples ranged from 67% to 82% for an overall accuracy of 76% ± 4%. The average accuracy for individual acylcarnitines in the high hematocrit samples ranged from 94% to 136% for an overall accuracy of 110% ± 10%.
| Donor | C0 | C2 | C3 | C4 | C5 | C6 | C8 | C10 | C12 | C14 | C16 | C18 |
| 1 | 78% | 65% | 69% | 79% | 77% | 75% | 78% | 75% | 74% | 83% | 76% | 77% |
| 2 | 81% | 74% | 75% | 80% | 78% | 76% | 79% | 76% | 76% | 80% | 79% | 79% |
| 3 | 89% | 81% | 83% | 86% | 85% | 84% | 89% | 82% | 90% | 91% | 89% | 86% |
| 4 | 66% | 65% | 67% | 70% | 68% | 64% | 68% | 70% | 73% | 75% | 70% | 73% |
| 5 | 81% | 72% | 79% | 81% | 80% | 73% | 81% | 76% | 79% | 85% | 82% | 83% |
| 6 | 67% | 44% | 64% | 74% | 72% | 69% | 73% | 72% | 73% | 78% | 72% | 72% |
| Mean | 77% | 67% | 73% | 78% | 77% | 73% | 78% | 75% | 78% | 82% | 78% | 78% |
| S.D. | 8.8% | 12.5% | 7.5% | 5.6% | 5.9% | 6.6% | 7.2% | 4.2% | 6.6% | 5.6% | 6.8% | 5.5% |
| %RSD | 11.5% | 18.7% | 10.3% | 7.1% | 7.7% | 9.0% | 9.2% | 5.5% | 8.6% | 6.8% | 8.7% | 7.0% |
| Overall | 76% | |||||||||||
| Donor Samples at Normal Level Hematocrit | ||||||||||||
| C0 | C2 | C3 | C4 | C5 | C6 | C8 | C10 | C12 | C14 | C16 | C18 | |
| Mid | 88% | 95% | 93% | 95% | 90% | 87% | 90% | 83% | 87% | 94% | 86% | 86% |
| Mid | 84% | 98% | 89% | 85% | 84% | 81% | 84% | 74% | 82% | 83% | 84% | 85% |
| Mid | 93% | 103% | 99% | 93% | 92% | 92% | 97% | 87% | 98% | 96% | 98% | 95% |
| Mid | 75% | 87% | 83% | 82% | 76% | 76% | 83% | 79% | 83% | 85% | 82% | 81% |
| Mid | 87% | 98% | 95% | 96% | 91% | 90% | 92% | 85% | 99% | 96% | 95% | 93% |
| Mid | 68% | 68% | 74% | 81% | 78% | 73% | 77% | 76% | 80% | 82% | 76% | 76% |
| Mean | 82% | 91% | 89% | 89% | 85% | 83% | 87% | 81% | 88% | 89% | 87% | 86% |
| S.D. | 9.4% | 12.7% | 8.9% | 6.9% | 6.9% | 8.0% | 7.2% | 5.2% | 8.3% | 6.7% | 8.1% | 7.1% |
| %RSD | 11.4% | 13.9% | 10.1% | 7.7% | 8.1% | 9.6% | 8.3% | 6.4% | 9.4% | 7.5% | 9.3% | 8.2% |
| Overall | 87% | |||||||||||
| Donor Samples at High Level Hematocrit | ||||||||||||
| C0 | C2 | C3 | C4 | C5 | C6 | C8 | C10 | C12 | C14 | C16 | C18 | |
| High | 94% | 142% | 115% | 109% | 108% | 110% | 113% | 102% | 118% | 114% | 108% | 106% |
| High | 96% | 138% | 114% | 108% | 107% | 100% | 106% | 95% | 108% | 101% | 101% | 98% |
| High | 101% | 141% | 121% | 114% | 110% | 107% | 115% | 108% | 118% | 113% | 110% | 103% |
| High | 95% | 143% | 119% | 113% | 112% | 105% | 114% | 100% | 117% | 111% | 116% | 111% |
| High | 92% | 128% | 120% | 122% | 112% | 105% | 112% | 104% | 109% | 110% | 102% | 97% |
| High | 86% | 125% | 113% | 120% | 115% | 111% | 110% | 98% | 106% | 99% | 99% | 95% |
| Mean | 94% | 136% | 117% | 114% | 111% | 107% | 112% | 101% | 113% | 108% | 106% | 102% |
| S.D. | 4.8% | 7.8% | 3.5% | 5.5% | 2.8% | 3.8% | 3.3% | 4.4% | 5.5% | 6.2% | 6.8% | 6.4% |
| %RSD | 5.2% | 5.7% | 3.0% | 4.8% | 2.5% | 3.6% | 2.9% | 4.3% | 4.9% | 5.7% | 6.4% | 6.3% |
| Overall | 110% | |||||||||||
Table 4: Calculation of % accuracy for acylcarnitines in 6 donor samples at low, normal and high hematocrit assuming 3.1 μL for the sample volume.
In summary, there was a negative bias of 24% for low hematocrit samples when volume of the excised samples was not corrected for volume based on hematocrit. There was a slight positive bias of 10% observed for samples at high hematocrit when the excised sample was not corrected for volume based on hematocrit. Using our reflectance technique to relate hematocrit and correcting for sample volume, the overall bias was reduced to less than 3%. In addition, correcting for sample volume showed improved precision of analysis, reducing the % relative standard deviations from 18.7% to 11.7%.
Conclusions
We have developed a novel approach that allows for the determination of hematocrit directly on DBSs using reflectance. In addition, we have shown that the sample volume is dependent on the percent hematocrit, and measurement of the percent hematocrit can be used to correct for sample volume. Donor samples at various hematocrits were used to test both models and demonstrated acceptable precision and improved accuracy over the standard technique, which assumes that all samples are 3.1 μL from a 3 mm punch. The ability to determine the hematocrit directly on DBSs using reflectance allows for sample volume correction, improving the accuracy of this sample collection technique. Correcting for volume greatly improves the accuracy of analysis and the reflectance format used allows for direct automatable volume corrections on the card without the need for off line procedures to test whole blood.
References
- O'Mara M, Hudson-Curtis B, Olson K, Yueh Y, Dunn J, et al. (2011) The effect of hematocrit and punch location on assay bias during quantitative bioanalysis of dried blood spot samples. Bioanalysis 3: 2335-2347.
- Denniff P, Spooner N (2010) The effect of hematocrit on assay bias when using DBS samples for the quantitative bioanalysis of drugs. Bioanalysis 2: 1385-1395.
- Edelbroek PM, van der Heijden J, Stolk LM (2009) Dried Blood Spot Methods in Therapeutic Drug Monitoring: Methods, Assays, and Pitfalls. Ther Drug Monit 31: 327-336.
- Li W, Tse FL (2010) Dried blood spot sampling in combination with LC-MS/MS for quantitative analysis of small molecules. Biomed Chromatogr 24: 49-65.
- Parker SP, Cubitt WD (1999) The use of the dried blood spot sample in epidemiological studies. J Clin Path 52: 633-639.
- Adam BW, Alexander JR, Smith SJ, Chace DH, Loeber JG, et al. (2000) Recoveries of Phenylalanine from Two Sets of Dried-Blood-Spot Reference Materials: Prediction from Hematocrit, Spot Volume, and Paper Matrix. Clin Chem 46: 126-128.
- Mei JV, Alexander JR, Adam BW, Hannon WH (2001) Use of Filter Paper for the Collection and Analysis of Human Whole Blood Specimens. J Nutr 131: 1631S-1636S.
- Wilhelm AJ, den Burger JCG, Vos RM, Chahbouni A, Sinjewel A (2009) Analysis of cyclosporin A in dried blood spots using liquid chromatography tandem mass spectrometry. J Chromatogr B Analyt Technol Biomed Life Sci 877: 1595-1598.
- Holub M, Tuschl K, Ratschmann R, Strnadová KA, Mühl A, et al. (2006) Influence of hematocrit and localisation of punch in dried blood spots on levels of amino acids and acylcarnitines measured by tandem mass spectrometry. Clin Chim Acta 373: 27-31.
- Orsini JJ, Yeman J, Caggana M, Bodamer OA, Mühl A (2010) Semi-quantitative method for determination of hematocrit in dried blood spots, using data collected in HPLC hemoglobin variant testing. Clin Chim Acta 411: 894-895.
- Peng M, Liu L, Peng L (2012) Evaluation of factors influencing accuracy in the analysis of succinylacetone in dried blood spots. Clin Chim Acta 413: 1265-1269.
- Johns M, Giller CA, Liu H (2001) Determination of Hemoglobin Oxygen Saturation from Turbid Media Using Reflectance Spectroscopy with Small Source-Detector Separations. Appl Spectrosc 55: 1686-1694.
- Meinke M, Gersonde I, Friebel M, Helfmann J, Müller G (2005) Chemometric determination of blood parameters using visible-near-infrared spectra. Appl Spectrosc 59: 826-835.
- Schmitt JM, Meindl JD, Mihm FG (1986) An Integrated Circuit-Based Optical Sensor for In Vivo Measurement of Blood Oxygenation. IEEE Trans Biomed Eng 33: 98-107.
- Serebrennikova YM, Smith JM, Huffman DE, Leparc GF, García-Rubio LH (2008) Quantitative interpretations of Visible-NIR reflectance spectra of blood. Opt Express 16: 18215-18229.
- Steinke JM, Shepherd AP (1988) Comparison of Mie theory and the light scattering of red blood cells. Appl Opt 27: 4027-4033.
- Steinke JM, Shepherd AP (1986) Role of Light Scattering in Spectrophotometric Measurements of Arteriovenous Oxygen Difference. IEEE Trans Biomed Eng 33: 729-734.
- Zonios G, Dimou A (2006) Modeling diffuse reflectance from semi-infinite turbid media: application to the study of skin optical properties. Opt Express 14: 8661-8674.
- Zhang S, Soller BR, Kaur S, Perras K, Salm TJV (2000) Investigation of Noninvasive in Vivo Blood Hematocrit Measurement Using NIR Reflectance Spectroscopy and Partial Least-Squares Regression. Appl Spectrosc 54: 294-299.
- Zijlstra WG, Buursma A, Meeuwsen-van der Roest WP (1991) Absorption spectra of human fetal and adult oxyhemoglobin, de-oxyhemoglobin, carboxyhemoglobin, and methemoglobin. Clin Chem 37: 1633-1638.
Relevant Topics
Recommended Journals
Article Tools
Article Usage
- Total views: 17661
- [From(publication date):
February-2013 - Apr 03, 2025] - Breakdown by view type
- HTML page views : 12806
- PDF downloads : 4855

