Research Article Open Access
Adsorption of Acid Dyes onto Bentonite and Surfactant-modified Bentonite
Akl MA*, Youssef AM and Al-Awadhi MM
Department of Chemistry, Faculty of Science, Mansoura University, Egypt
- *Corresponding Author:
- Akl MA
Department of Chemistry, Faculty of Science
Mansoura University, P.O. Box 70
Mansoura, Egypt
Tel: +20-5022-42388
Fax: +20-5022-46781
E-mail: magdaakl@yahoo.com
Received date: September 23, 2013; Accepted date: October 23, 2013; Published date: October 25, 2013
Citation: Akl MA, Youssef AM, Al-Awadhi MM (2013) Adsorption of Acid Dyes onto Bentonite and Surfactant-modified Bentonite. J Anal Bioanal Tech 4:174. doi: 10.4172/2155-9872.1000174
Copyright: © 2013 Akl MA, et al. This is an open-access article distributed under the terms of the Creative Commons Attribution License, which permits unrestricted use, distribution, and reproduction in any medium, provided the original author and source are credited.
Visit for more related articles at Journal of Analytical & Bioanalytical Techniques
Abstract
Adsorption of Congo red (CR) from water via batch adsorption experiments onto bentonite and CTAB-modified bentonite (CTAB-MBn) was investigated. Studies concerning the factors influencing the adsorption capacities of bentonite and CTAB-MBn, such as initial dye concentration, adsorbent dosage, pH, ionic strength, contact time and temperature were systematically investigated and discussed. The results revealed that CTAB-modified bentonite demonstrated high adsorption capacities toward acid dyes, while bentonite exhibited sorption capacities lower than CTAB-MBn. The kinetics data were analyzed using first order and pseudo-second order models. It was best described by the pseudo-second order model. The isotherm data were investigated according to Langmuir and Freundlich equations. Thermodynamic parameters ΔG°, ΔH° and ΔS° were calculated for the adsorption of CR on bentonite and CTAB-MBn ; the value of ΔG° showed the spontaneous nature of adsorption for both sorbents.
Keywords
Adsorption; Congo red; Bentonite; Surfactant
Introduction
Synthetic dyes can be found in the wastewater from various industries like paper, leather, plastics and textiles [1]. Wastewater discharges into rivers and natural streams from the industries that use dyes poses stark environmental problems. Even minor quantities of dyes can color huge water bodies, which influences aesthetic merit and decreases light penetration needed for photosynthesis. Furthermore, many of dyes are toxic or carcinogenic [2,3]. Hence, the elimination of dyes from wastewater accepted environmental importance. Many approaches have been developed for decontamination of water, e.g. precipitation, electrodialysis, adsorption, filtration, coagulation, oxidation and membrane separation. However, adsorption is known to be one of the most effective techniques to eliminate dyes from water. Activated carbon has been familiarized as adsorbent due to its great sorption capacity for the dyes [4]. However the high cost has led us seeking for low-cost sorbents. Recently, low-cost materials such as fly ash [5], natural zeolite [6], red mud [7] and coir pith [8] accepted vital interest for wastewater treatment. Several modified bentonite are also reported to be inexpensive and effective in water decontamination [9-12].
Acid dyes are the most problematic due to their bright colour, acidic and water soluble reactive characteristics. Several studies have been executed on adsorption of basic dyes by clay minerals [13]. However, there is very little works on adsorption of acidic dyes [14]. Generally, the adsorption capacity for anionic dyes is much lower than for cationic dyes, as result of weak attractions between acidic charges on the dyes and the negative surface of clay.
Bentonite comprises of one octahedral alumina sheet lying between two tetrahedral layers of silica. The permanent negative charge of bentonite is attributed to the isomorphous replacement of Al3+ for Si4+ in the tetrahedral layer and Mg2+ for Al3+ in the octahedral layer. This negative charge is balanced by the presence of replaceable cations (Ca2+, Na+, etc.) in the lattice structure, which enhance adsorbing cationic pollutants [15-17]. Although, bentonite weakly adsorbs acidic contaminants due to repulsion force between the anion and the negative charge on the surface of the bentonite [18,19]. Several authors have informed the use of bentonite modified and organobentonite with a cationic surfactant for acidic dye elimination via high loading quantity of surfactant [20-22]. Preceding studies had shown that the main mechanism of the adsorption interpreted the acidic dye elimination is the anionic exchange between excessive anions and pollutants from the surfactant [23]. Hence, to obtain a high sorption capacity, modifications need surfactantsat twice the CEC. Accordingly, the cost increases.
In the present study, bentonite was modified by CTAB resulting in a new adsorbent, CTAB-modified bentonite (CTAB-MBn), to improve the sorption capacity for acidic contaminants. Bentonite and (CTAB-MBn) were characterized by scanning electron microscopy (SEM), Fourier-transform infrared spectroscopy (FTIR) and Nitrogen adsorption measurements. The capacity of adsorption for the removal Congo red was estimated. The influences of pH, temperature, initial concentration and equilibrium time on the adsorption were also investigated in batch methods.
Experimental Procedure
Materials and methods
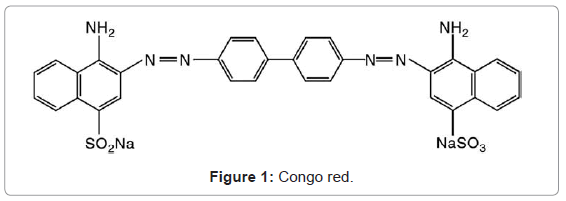
Bentonite applied in this investigation was obtained from Egypt. The chemical component of the bentonite is illustrated in Table 1 (determined by x-ray fluorescence). Congo red dye was purchased from Sigma Aldrich. Congo red structure of this dye is illustrated in Figure 1.
| SiO2 | Al2O3 | Fe2O3 | Na2O | MgO | CaO | TiO2 | K2O | SO3 | other | Loss of ignition |
|---|---|---|---|---|---|---|---|---|---|---|
| 70.7 | 15.5 | 2.23 | 0.212 | 0.85 | 0.46 | 0.00 | 2.7 | 0.170 | 1.06 | 8.6 |
Table 1: The chemical composition of Sodium bentonite (%).
Synthesis of surfactant-modified bentonite (CTAB-MBn)
The surfactant-modified bentonite was synthesized by the following steps. For CTAB-B synthesis, 25 g bentonite was put in 250 mL of water containing 5 g of CTAB. The reaction components were stirred at 25°C for 12 h. The product was filtered and washed repeatedly with bidistilled water till no bromide ion was determined by AgNO3 solution (0.1 M). The CTAB-B was dried at 110°C for 6 h.
Characterization
The specific surface area of the adsorbents was estimated by BET method (Brunauer-Emmet-Teller) using liquid N2 adsorption at 196° K by means of a conventional volumetric apparatus. This was determined by a McLeod system connected to the apparatus. The morphology of the samples surfaces were investigated using scanning electron microscopy (JEOL, model 6400).
Adsorption studies
The batch sorption was executed on Shaking Water Bath (NE5, Nickel-Electro Ltd., UK) at 200 rpm. To investigate the influence of bentonite and CTAB-MBn on sorption capacities of CR experiments, 0.1 g adsorbent and 50 mL CR solution (initial conc. 1000 mg/L, pH 6.9) were used. The method was operated under shaking at 25°C till adsorption balance was accomplished. The influence of pH on CR elimination was studied via adjusting 50 ml CR solutions (300 mg/L CR) at pH range (5.0-10.0), using 0.01 M NaOH or HCl solution with 0.1 g adsorbent for 360 min at 25°C. The influence of temperature on CR elimination was executed in the 50 mL CR solutions (1000 mg/L, pH 6.9,) by adding 0.1 g adsorbent till balance was completed. The influence of sorption time on CR elimination was executed in the 50 mL CR solutions (300 mg/L, pH 6.9), by adding 0.1 g adsorbent at 25°C for determined period of time. The influence of the initial CR concentrations on CR elimination was executed by exciting 50 mL several dye concentrations of CR solution at conditions: pH 6.9; 0.1 g/50 mL; T 25°C; 360 min. Subsequently, the samples were filtered and the adsorbate of residual concentrations was measured. The quantities of CR removed via sorbents qe and percent extracted %E can be calculated by the subsequent equations:
 (1)
(1)
Where qe (mg/g) is the equilibrium concentration of CR on the adsorbent, Co and Ce are the initial and equilibrium liquid-phase concentrations of dye (mg/g), respectively, m (g) is the mass of adsorbent and V (L) is the volume of solution. The concentration of CR in the residual solution was analyzed spectrophotometrically by UV-Vis spectrophotometer at wavelength 498 nm and the amount of adsorption qt was calculated according to equation (1).
Results and Discussion
Characterization of bentonite and CTAB-MBn
The surface area and porosity of an adsorbent are significant parameters in determining its adsorption capacity as well as its adsorption performance [24]. The adsorption isothermsso obtained were analyzed via the traditional BET equation. Table 2 lists the surface areas, total pore volumes and mean pore diameters of bentonite and CTAB-MBn. Table 2 reveals that modification of bentonite with (CTAB) was found to be linked with a reduction in the surface area, the mean diameter and total pore volume.
| Adsorbent | Surface area SBET (m2/g) | BET-C constant | Pore volume VT (ml/g) | Aver. pore diam. r (nm) |
|---|---|---|---|---|
| Bentonite | 32.17 | 75.29 | 0.029 | 1.8 |
| CTAB-MBn | 18.41 | 37.13 | 0.015 | 1.66 |
Table 2: The textural properties of the investigated Bentonite and CTAB-MBn as determined from nitrogen adsorption isotherms.
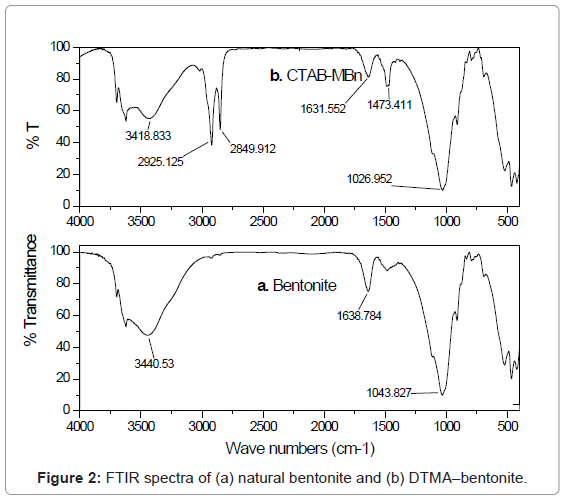
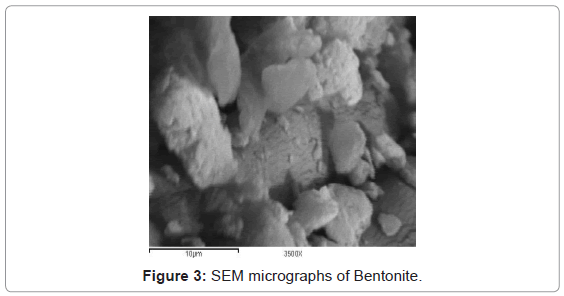
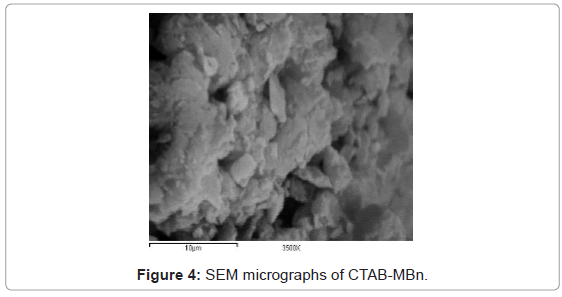
These textural modifications are illustrated when the textural properties of bentonite are compared with those of CTAB-MBn. The evident changes in the textural parameters caused by modifying bentonite by cationic surfactant may be ascribed to the blocking of relatively fine pores via the surfactant molecules leaving behind the comparatively wide pores [25]. To obtain proof for the adsorption of CTAB into bentonite sample, FTIR spectra were shown in Figure 2. Two bands at 2850 and 2925 cm-1, which were observed by the surfactant modified bentonite, could be assigned to the asymmetric and symmetric stretching vibrations of the CH3 and CH2 of the aliphatic chain of the CTAB [26]. This band is not observed in the IR spectrum of natural bentonite. Modification of bentonite by CTAB was associated also with evident change in the morphology and particle size. The SEM images of bentonite and CTAB-MBn are shown in Figure 3 and 4, respectively. Obviously, the agglomerates of bentonite contain few numbers of particles compared with those of CTAB-MBn. Several of the particles in bentonite and CTAB-MBn show laminar crystalline habit characteristic of phyllosilicates. However, these certain particles dominate more in CTAB-MBn. Interaction of surfactant molecules in the interlayers may also stand behind the domination of comparatively large laminar crystallites and large agglomerates.
Effect of pH
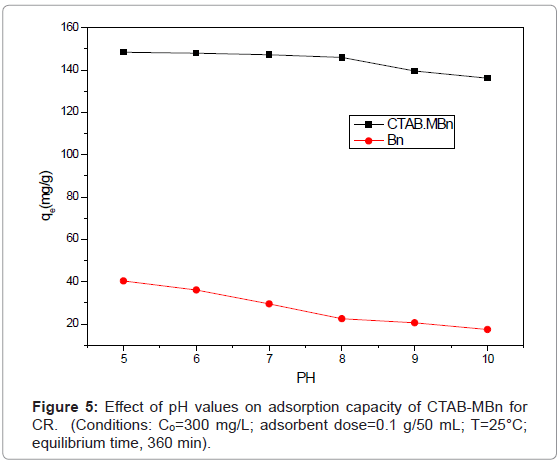
Bentonite and CTAB-MBn have proved to be an effective adsorbent for the removal of acidic dye, CR via adsorption from aqueous solution, as can be seen from the data recorded in Figure 5. It can be shown that the influence of the pH on the sorption capacity of CR adsorbed is weak. When the pH increases from pH 5-10, the amount of CR adsorbed at equilibrium (qe) decrease slowly from 149 to 138 mg/g. The minor decrease in adsorption may be due to the repulsion between acidic dye molecules and the abundance of OH¯ ions at higher pH values.
Effect of initial dye concentration
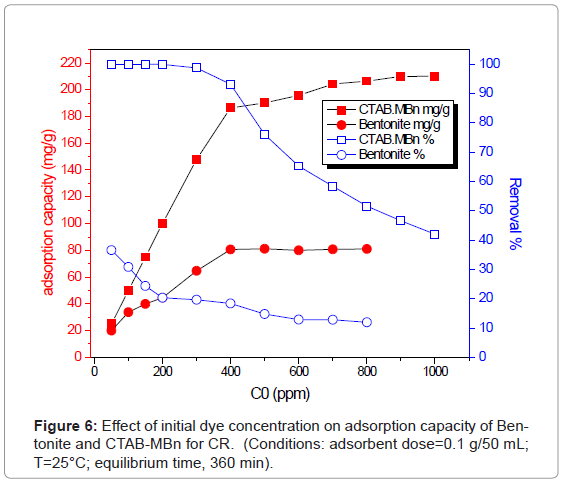
In general, the sorption of dye was dependent on the initial concentration of the dye [8]. Figure 6 shows the effect of initial CR concentration on the adsorption capacity of Bentoniteand CTAB-MBn toward CR. It can be shown that qe increased sharply from 186.40 to 204.275 mg/g with increasing the initial CR concentration from 400 to 700 mg/L, while that of Bentonite was 15.41 mg/g to 36.78 mg/g from 100 to 400 mg/L. However, the amount of CR adsorbed at equilibrium (qe) enhanced slightly from 204.275 to 210.10 mg/g with an increase in the initial CR concentration from 700 to 1000 mg/l, while that of Bentonite was 36.78 mg/g to 37.10 mg/g from 400 to 800 mg/L at 25°C. Figure 6 shows higher removal of CR onto CTAB-MBn than that of Bentonite. It appears that an increase in adsorbate concentration results in an increase in the driving force, which leads to an increase in the CR diffusion rate [27,28]. The amounts of CR adsorbed at equilibrium (qe) increase from 50 to 210.10 mg/g and from 9.145 to 37.10 mg/g, for CTAB-MBn and Bentonite, respectively, and the results indicate that the CTAB-MBn is efficient adsorbent for CR.
Effect of amount of adsorbent
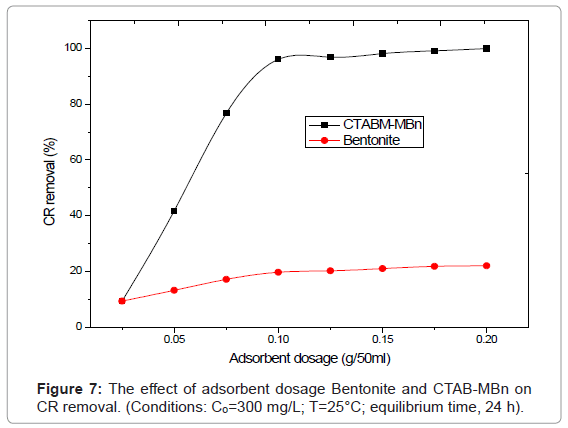
The effect of adsorbent dosage on removal of CR by Bntonnite and CTAB-MBn is shown in Figure 7. When the sorbent dose increases from 0.025 to 0.2 g, the percent dye removals by Bntonnite and CTAB-MBn increase from 8.79% to 22.86% and from 9.32 % to 99.94%, respectively.
It was observed that the adsorption of the CR enhanced rapidly with increasing the amount of adsorbent from 0.025 to 0.075 g and slightly enhanced from 0.1 to 0.25 g. This can be simply attributed to the increased sorbent surface area and availability of more sorption site. However, the amount of CR adsorbed (mg/g) was found to decrease with further increase in adsorbent dosage due to the high number of unsaturated adsorption sites.
Effect of volume of Congo red
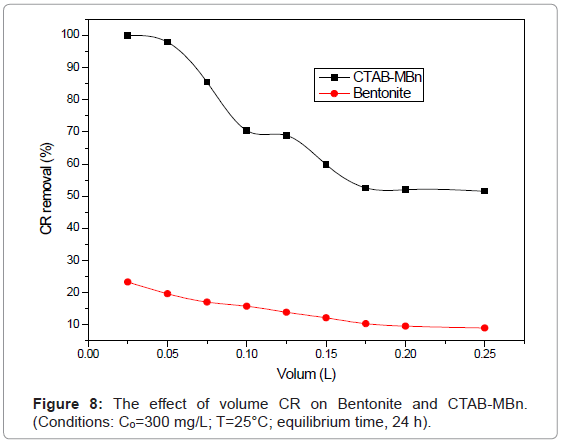
Volume of CR solution is one of the factors that influence the effective capacity of the adsorption for CR. Various CR volumes (0.025- 0.25 L) with 0.1 g sorbent were applied at pH 6.9, 25°C, and CR 300 mg/l. Figure 8 shows higher removal of CR onto CTAB-MBn than that of Bentonite. CR removal decreased slightly from 99.95% to 51.56% (CTAB-MBn), and from 23.32% to 9.10% (Bentonite) with increasing CR volume from 0.025 to 0.25 L.
Effect of contact time
Figure 9 showed the influence of contact time on the sorption capacity of Bentoniteand CTAB-MBn for dye solution when concentration 300 ppm. It is evident that the sorption capacity of Bentonite and CTABMBn enhance rapidly by the increase of contact time from 0 to 90 min, and more than 92% of the equilibrium sorption capacity for CR executed at 90 min. In the next 120 min, the sorption capacity became constant and the adsorption accomplished equilibrium. Consequently, 120 min was chosen as the contact time for the sorption of CR onto the aggregates under our study conditions.
Effect of ionic strength
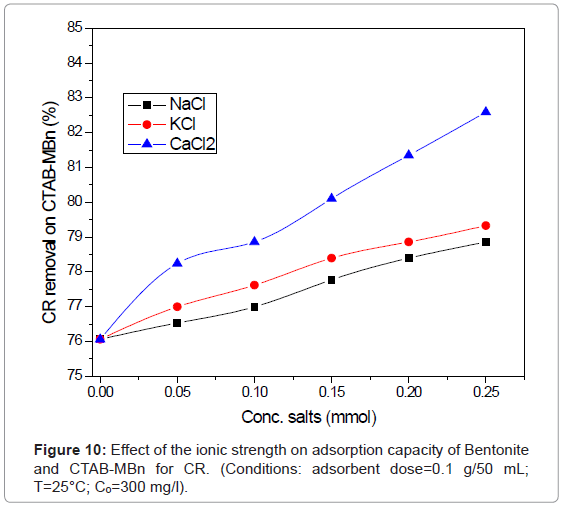
The availability of salt in water leads to high ionic strength may be more effective on the efficiency of the adsorption process [29]. As can be shown in Figure 10, the variation of salts concentration (NaCl, KCl, and CaCl2) makes a major effect on the range of acidic dyes adsorption. The current study indicates that the sorption of negatively charged CR, on negatively charged Bentoniteand positively charged CTABMBn enhanced with the addition in the order: NaCl<KCl<CaCl2. The escalates of ionic strength in aqueous solution may result in the compression of the diffuse double layer on the adsorbent. This eases the electrostatic attraction and participates to the adsorption consequently [30-32].
Effect of temperature
The influence of temperature on adsorption was investigated at 25, 35 and 45°C, and the consequences are shown in Table 3. It could be clearly seen that, the amount adsorbed at equilibrium increases with increasing temperature. When the temperature increased from 25°C to 45°C, the maximum amounts of CR removed by Bentoniteand CTABMBn are found to be increased from 37.050 to 45.596 mg/g and 210.10 to 224.361 mg/g, respectively. It is found that higher temperature eased the sorption of CR on CTAB-MBn. It is common that increasing temperature may create a swelling influence inside the adsorbent structure, penetrative the additional big dye molecule [33].
| Samples | Qe (mg/g) | ||
| 25°C | 35°C | 45°C | |
| Bentonite | 37.050 | 41.7099 | 45.596 |
| CTAB-MBn | 210.104 | 217.629 | 224.361 |
Table 3: Effect of temperature on maximum adsorption capacities of CR by Bentonite CTAB-MBn.
Adsorption kinetics
The value constant of adsorption is specified from the first-order rate expression given by Lagergren [34] can be expressed as equation (2):
 (2)
(2)
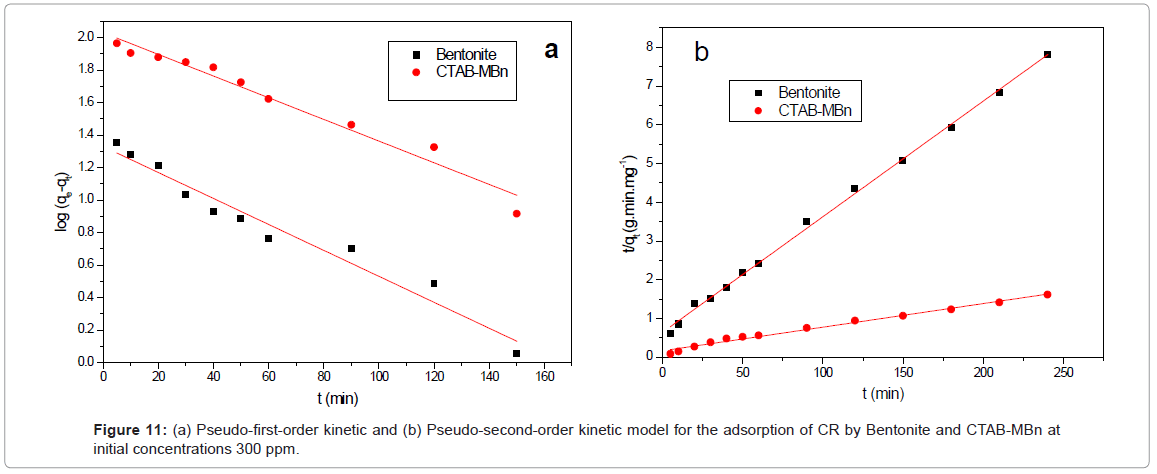
Where qe and qt (mg/g) are the amounts of CR adsorbed at equilibrium and at time t, respectively, and k, is the equilibrium constant (min-1), which were obtained from the slopes of the linear plots of ln(qe-qt) versus t, as shown in Figure 11a.
The pseudo-second-order model is depended on the supposition of chemisorption of the adsorbate on the adsorbents. This model [35] can be expressed as equation (3):
 (3)
(3)
Where k2 (g/mg min) is the equilibrium rate constant for the pseudo second-order adsorption and qe can be obtained from the plot of t/qt against t, as shown in Figure 11b. A comparison of the results with the correlation coefficients for the first-order kinetic and second-order kinetic models is shown in Table 4. For Bentonite CTAB-MBn: the second order model is the best fit model for experimental kinetic data, this because of the value of the calculated qe approve very well with the experimental data and r2 is greater than 0.986 for all adsorbents. These results also indicated that the applicability of this kinetic equation and the second-order nature of the adsorption process of CR on clays [36].
| Pseudo first-order kinetic model | ||||
| qe,exp(ppm) | Qe,1cal (mg/g) | k1 (min-1) | R12 | |
| Bentonite | 30.67 | 21.3810978 | 0.018401 | 0.95747 |
| CTAB-MBn | 148.41 | 107.359381 | 0.015361 | 0.96273 |
| Pseudo second-order kinetic model | ||||
| qe,exp (ppm) | Qe,2cal (mg/g) | k2 (g /mg.min) | R22 | |
| Bentonite | 30.67 | 33.4896 | 0.00057 | 0.99798 |
| CTAB-MBn | 148.41 | 163.9344 | 6.17388*10-6 | 0.98696 |
Table 4: Kinetic parameters for the adsorption of Congo red onto Bentonite CTABMBn.
Adsorption isotherms
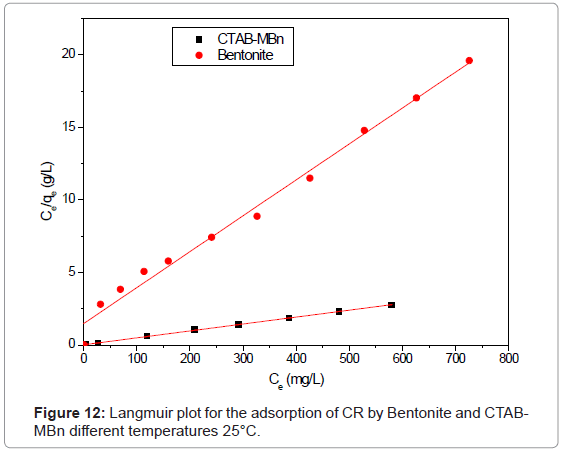
The equilibrium adsorption isotherms were explained using Langmuir and Freundlich isotherm equations [37,38], respectively:
 (4)
(4)
 (5)
(5)
Where, b is Langmuir equilibrium constant (L mg-1) and qm (mg g-1) is the monolayer adsorption capacity; n and Kf (mg g-1) are the Freundlich’s constants. The Freundlich parameters can be obtained by the following linearized equation:
 (6)
(6)
By linear plotting ln qe as the function of ln Ce, the values of Kf and n can be obtained from the intercept and the slope of the plot (Figure 12). The isotherm parameters for the adsorption of CR onto Bentonite and CTAB-MBn are given in Table 5. Langmuir adsorption model provides the best fit with experimentally obtained data for Bentonite and CTABMBn with (r2>0.986). However, the Freundlich adsorption can be used also for modeling the equilibrium data for the three sorbents (r2>0.9.36 for all cases). This shows the surface of CTAB-MBn was enveloped by the monolayer of Congo red molecules.
| Adsorbent | Langmuir | Freundlich | ||||
|---|---|---|---|---|---|---|
| qmax (mg/g) | b (L/mg) | R2 | Kf (mg/g) | n | R2 | |
| Bentonite | 40.4 | 0.0167 | 0.9873 | 2.06 | 9.0432 | 0.9373 |
| CTAB-MBn | 210 | 0.246 | 0.9993 | 111.877 | 2.1656 | 0.9467 |
Table 5: Adsorption isotherm parameters for the adsorption of congo red on clays.
Thermodynamic studies
Thermodynamic parameters were calculated from the difference of the thermodynamic distribution coefficient, kc with change in temperature. The standard free energy change, ΔG°, was calculated using the expression:
 (7)
(7)
 (8)
(8)
Where, R is gas constant (8.314 J/mol/K), T is the absolute temperature in K° and Kc is the Langmuir constant. Standard enthalpy (ΔH°) and entropy (ΔS°) of adsorption could be estimated from Van’t Hoff equation:
 (9)
(9)
The thermodynamic parameters are offered in Table 6. It is evident from the table that the values of ΔG° are negative for Bentonite and CTAB-MBn. The negative values of ΔG° for all adsorbents at various temperatures indicate the process to be feasible and spontaneous. Actually that the values of the ΔG° decrease with increasing temperature shows the increase of spontaneous influence. For all the sorbents, the positive value of ΔH° suggested the endothermic nature of the adsorption process. Moreover, the positive value of ΔS° also indicates the increased randomness during sorption process.
| Sample Code | ΔH° (KJ/mol) | ΔS° (KJ/mol K) | ΔG° (KJ/mol) | ||
|---|---|---|---|---|---|
| 298 K | 308 K | 318 K | |||
| Bentonite | 12.37991 | 0.112323 | -21.104 | -22.191 | -23.352 |
| CTAB-MBn | 12.71387 | 0.133851 | -27.1932 | -28.0467 | -29.872 |
Table 6: Thermodynamic parameters for adsorption of CR by Bentonite and CTABMBn at different temperatures.
Conclusion
The result of the present study reveals that Bentonite and CTABMBn can be a frequently valiable adsorbent for application in the treatment of industrial wastewater and water polluted with dyes. The amount of CR adsorbed was found to increase in order CTABMBn (210.10 mg/g)>Bentonite (37.10 mg/g). Results show that the adsorption capacity increases with the increase of initial CR concentration, adsorbent dosage, temperature and pH in the range of 5-9, where ionization surface area. The adsorption of CR onto the CTAB-Mn reached equilibrium within about 120 min. The results could be well described by Langmuir isotherm model. The adsorption kinetics followed a pseudo-second order kinetic model was involved in the adsorption process. Thermodynamic studies indicated that the adsorption process was endothermic and spontaneous in nature.
References
- Chiou MS, Ho PY, Li HY (2004) Adsorption of anionic dyes in acid solutions using chemically cross-linked chitosan beads. Dyes Pigm 60: 69-84.
- Chen KC, Wu JY, Huang CC, Liang YM, Hwang SC (2003) Decolorization of azo dye using PVA-immobilized microorganisms. J Biotechnol 101: 241-252.
- Yang C, Gong R, Liu B, Liu H, Sun Y, et al. (2004) Utilization of powdered peanut hull as biosorbent for removal of anionic dyes from aqueous solution. Ying Yong Sheng Tai Xue Bao 15: 2195-2198.
- Sanghi R, Bhattacharya B (2002) Review on decolorisation of aqueous dye solutions by low cost adsorbents. Color Technol 118: 256-269.
- Kara S, Aydiner C, Demirbas E, Kobya M, Dizge N (2007) Modeling the effects of adsorbent dose and particle size on the adsorption of reactive textile dyes by fly ash. Desalination 212: 282-293.
- Wang S, Ariyanto E (2007) Competitive adsorption of malachite green and Pb ions on natural zeolite. J Colloid Interface Sci 314: 25-31.
- Namasivayam C, Arasi DJSE (1997) Removal of Congo red from wastewater by adsorption onto waste red mud. Chemosphere 34: 401-417.
- Namasivayam C, Kavitha D (2002) Removal of Congo red from water by adsorption onto activated carbon prepared from coir pith, an agricultural solid waste. Dyes Pigm 54: 47-58.
- Ozcan AS, Ozcan A (2004) Adsorption of acid dyes from aqueous solutions onto acid-activated bentonite. J Colloid Interface Sci 276: 39-46.
- Zohra B, Aicha K, Fatima S, Nourredine B, Zoubir D (2008) Adsorption of Direct Red 2 on bentonite modified by cetyltrimethylammonium bromide, Chem Eng J 136: 295-305.
- Eren E, Afsin B (2007) Effect of cation exchanged bentonites (CEBs) on the aggregation of a cresol based dye. Dyes Pigm 72: 228-232.
- Ayari F, Srasra E, Trabelsi-Ayadi M (2007) Retention of organic molecule “quinalizarin” by bentonitic clay saturated with different cations. Desalination 206: 499-506.
- Ghosh D, Bhattacharyya KG (2002) Adsorption of methylene blue on kaolinite. Appl Clay Sci 20: 295-300.
- Bulut E, Ozacar M, Sengil IA (2008) Equilibrium and kinetic data and process design for adsorption of Congo Red onto bentonite. J Hazard Mater 154: 613-622.
- Hu QH, Qiao SZ, Haghseresht F, Wilson MA, Lu GQ (2006) Adsorption study for removal of basic red dye using bentonite. Ind Eng Chem Res 45: 733-738.
- Tahir SS, Rauf N (2006) Removal of a cationic dye from aqueous solutions by adsorption onto bentonite clay. Chemosphere 63: 1842-1848.
- Wang CC, Juang LC, Hsu TC, Lee CK, Lee JF, et al. (2004) Adsorption of basic dyes onto montmorillonite. J Colloid Interface Sci 273: 80-86.
- Baskaralingam P, Pulikesi M, Elango D, Ramamurthi V, Sivanesan S (2006) Adsorption of acid dye onto organobentonite. J Hazard Mater 128: 138-144.
- Crini G (2006) Non-conventional low-cost adsorbents for dye removal: A review. Bioresour Technol 97: 1061-1085.
- Ceyhan O, Baybas D (2001) Adsorption of some textile dyes by hexadecyltrimethylammonium bentonite. TUrk J Chem 25: 193-200.
- Jovic-Jovicic N, Milutinovic-Nikolic A, Grzetic I, Jovanovic D (2008) Organobentonite as efficient textile dye sorbent. Chem Eng Technol 31: 567-574.
- Ozcan AS, Erdem B, Ozcan A (2004) Adsorption of Acid Blue 193 from aqueous solutions onto Na-bentonite and DTMA-bentonite. J Colloid Interface Sci 280: 44-54.
- Ma J, Cui B, Dai J, Li D (2011) Mechanism of adsorption of anionic dye from aqueous solutions onto organobentonite. J Hazard Mater 186: 1758-1765.
- El-Geundi MS, Farrag TE, Abd El-Ghany HM (2005) Adsorption equilibrium of a herbicide (pendimethalin) onto natural clay. Adsorp Sci Technol 23: 437-453.
- Bhuttacharyya KG, Gupta SS (2006) Kaolinite, montmorillonite, and their modified derivatives as adsorbents for removal of Cu(II) from aqueous solution. Sep Purif Technol 50: 388-397.
- Gans P (1975) Vibrating molecules: An Introduction to the interpretation of infrared and raman spectra. Chapman and Hall, London, UK.
- Mall ID, Srivastava VC, Agarwal NK, Mishra IM (2005) Removal of congo red from aqueous solution by bagasse fly ash and activated carbon: Kinetic study and equilibrium isotherm analyses. Chemosphere 61: 492-501.
- Mall ID, Srivastava VC, Kumar GVA, Mishra IM (2006) Characterization and utilization of mesoporous fertilizer plant waste carbon for adsorptive removal of dyes from aqueous solution. Colloids Surf A: Physicochem Eng Aspects 278: 175-187.
- Anirudhan TS, Ramachandran M (2007) Surfactant-modified bentonite as adsorbent for the removal of humic acid from wastewaters. Appl Clay Sci 35: 276-281.
- Alberghina G, Bianchini R, Fichera M, Fisichella S (2000) Dimerization of Cibacron Blue F3GA and other dyes: Influence of salts and temperature. Dyes Pigm 46: 129-137.
- Peng X, Luan Z, Zhang H (2006) Montmorillonite-Cu(II)/Fe(III) oxides magnetic material as adsorbent for removal of humic acid and its thermal regeneration. Chemosphere 63: 300-306.
- Li Q, Yue QY, Sun HJ, Su Y, Gao BY (2010) A comparative study on the properties, mechanisms and process designs for the adsorption of non-ionic or anionic dyes onto cationic-polymer/bentonite. J Environ Manage 91: 1601-1611.
- Bhattacharyya KG, Sarma A (2003) Adsorption characteristics of the dye, brilliant green, on neem leaf powder, Dyes Pigm 57: 211-222.
- Lagergren S (1898) About the theory of so-called adsorption of soluble substances. Kungliga Svenska Vetenskapsakademiens Handlingar, Iran 24: 1-39.
- Ho YS, McKay G (1999) Pseudo-second order model for sorption processes. Process Biochem 34: 451-465.
- Sun S, Wang A (2006) Adsorption kinetics of Cu(II) ions using N,O-carboxymethyl-chitosan. J Hazard Mater 131: 103-111.
- Periasamy K, Namasivayam C (1995) Removal of nickel(II) from aqueous solution and nickel plating industry wastewater industry using an agriculture waste: Peanut hull. Waste Manage 15: 63-68.
- Hameed BH, Ahmad AA (2009) Batch adsorption of methylene blue from aqueous solution by garlic peel, an agricultural waste biomass. J Hazard Mater 164: 870-875.
Relevant Topics
Recommended Journals
Article Tools
Article Usage
- Total views: 19216
- [From(publication date):
November-2013 - Apr 11, 2025] - Breakdown by view type
- HTML page views : 13867
- PDF downloads : 5349

