Research Article Open Access
Assessing Long Term Effects of Bioremediation: Soil Bacterial Communities 14 Years after Polycyclic Aromatic Hydrocarbon Contamination and Introduction of a Genetically Engineered Microorganism
| Xiaoci Ji1, Steven A Ripp2, Alice C Layton2, Gary S Sayler2,3, Jennifer M DeBruyn1* | |
| 1Department of Biosystems Engineering and Soil Science, The University of Tennessee, USA | |
| 2Center for Environmental Biotechnology, The University of Tennessee, USA | |
| 3Department of Microbiology, The University of Tennessee, USA | |
| Corresponding Author : | Jennifer M DeBruyn Department of Biosystems Engineering and Soil Science The University of Tennessee, USA Tel: 865-974-7266 E-mail: jdebruyn@utk.edu |
| Received September 05, 2013; Accepted October 04, 2013; Published October 10, 2013 | |
| Citation: Ji X, Ripp SA, Layton AC, Sayler GS, DeBruyn JM (2013) Assessing Long Term Effects of Bioremediation: Soil Bacterial Communities 14 Years after Polycyclic Aromatic Hydrocarbon Contamination and Introduction of a Genetically Engineered Microorganism. J Bioremed Biodeg 4:209. doi: 10.4172/2155-6199.1000148 | |
| Copyright: © 2013 Ji X, et al. This is an open-a ccess article distributed under the terms of the Creative Commons Attribution License, which permits unrestricted use, distribution, and reproduction in any medium, provided the original author and source are credited. | |
Related article at Pubmed Pubmed  Scholar Google Scholar Google |
|
Visit for more related articles at Journal of Bioremediation & Biodegradation
Abstract
Environmental contamination by organics such as polycyclic aromatic hydrocarbons (PAHs) generally changes native microbial communities. However our understanding of microbial responses has been limited to short term studies (i.e., less than 2-3 years) so long term community responses are not as well understood. In 1996, the genetically engineered microorganism Pseudomonas fluorescens HK44 was released into polycyclic aromatic hydrocarbon (PAH)-contaminated soil in lysimeters to monitor in situ PAH-biodegradation.
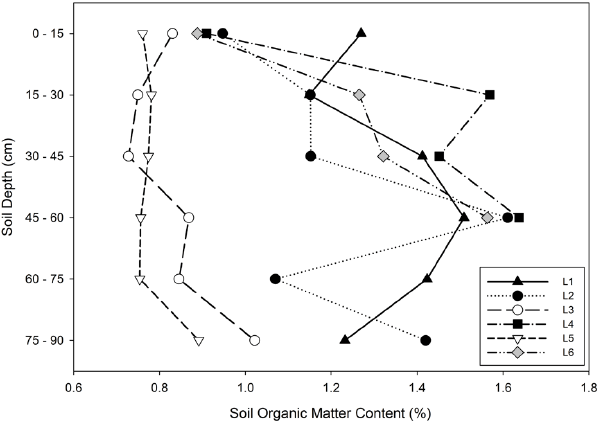
The objective of this study was to assess the long term impacts of PAH contamination and addition of HK44 on the indigenous soil bacterial community structure. In 2010, 14 years after the lysimeter experiment initiation, lysimeters were unsealed and sampled. Although PAHs were degraded and PAH concentrations fell below detectable levels within approximately the first two years of this experiment, lysimeters that had received PAHs had significantly higher soil organic matter content (1.30 ± 0.23%) than control lysimeters with clean soils (0.81 ± 0.08%). Pyrosequencing of 16S rRNA gene amplicon libraries revealed a distinct bacterial community structure in the lysimeters that had received PAHs. In contrast, there were no discernible differences in soil chemistry or bacterial community structures in lysimeters where HK44 was inoculated compared to those to which HK44 was not inoculated. These results indicate that although the initial perturbations are no longer detectable, the addition of PAHs had long term influences on the bacterial communities, while the introduction of the genetically engineered microorganism HK44 did not.
| Keywords |
| Polycylic aromatic hydrocarbons (PAHs); Biodegradation; Bacterial community structure; 16S rRNA gene pyrosequencing |
| Introduction |
| Polycyclic aromatic hydrocarbons (PAHs) are widespread and persistent organic pollutants with known carcinogenic, toxigenic and mutagenic effects [1]. Since many soil microorganisms are capable of transforming and mineralizing PAHs, microbial biodegradation is a viable method for remediation of contaminated soils [2-4]. PAH contamination introduces a new organic source to the environment and generally causes shifts in bacterial community structure and function [5-9]. Bacteria belonging to the Proteobacteria phylum are generally found to be the most active and abundant taxa in soil bacterial communities exposed to PAHs [5,6]. However, these studies on bacterial community responses tend to focus on relatively short time periods (i.e., 200 days in Vinas et al. [10], six months in Lors et al. [5], and 88 days in Margesin et al. [11]), and on soils in which PAHs are still detectable. The long term effects of PAH contamination, after PAHs are degraded, are less studied. |
| A soil lysimeter study was initiated in 1996 to test the in situ performance of a bioluminescent bioreporter, Pseudomonas fluorescens HK44 (HK44), the first genetically engineered microorganism (GEM) to be field tested in the U.S. for bioremediation purposes [12,13]. HK44 contains the Vibrio fischeri (since reclassified as Aliivibrio fischeri) luminescence genes (luxCDABE) inserted into a naphthalene degradation pathway gene (nahG) and luminesces during degradation of 2- or 3-ring PAHs, [12-15]. The study consisted of six soil lysimeters, each derived from the same initial soil mixture, containing a combination of PAH contaminants and/or HK44 inocula [12]. Biodegradation of PAHs in these lysimeters along with air stripping and other physical processes resulted in naphthalene concentrations falling below 10 ppm after 474 days [12,16], and the concentration of HK44 was significantly reduced after two years [13] and not detectable after 14 years [16]. While the contaminants and GEM were no longer detectable, it is unknown whether there were long term impacts from this initial perturbation on the native soil microbial communities. |
| To better understand the long term environmental risks of contamination and use of GEMs in bioremediation efforts, we assessed the long term impacts of PAH contamination and the release of the bioluminescent bioreporter HK44 on native soil microbial communities. We tested two hypotheses: 1) 14 years after a PAH contamination event, there would be no significant differences in soil bacterial community structures in lysimeters with and without PAHs, and 2) 14 years after introduction of HK44, there would be no significant differences in soil bacterial community structures in lysimeters that were inoculated compared to those that were not. |
| Materials and Methods |
| Sampling |
| Six lysimeters (4 m depth×2.5 m diameter) were established in 1996 and are described in Ripp et al. [12]. Lysimeters 1, 2 and 4 (L1, L2, and L4) contained PAH-contaminated soil and were inoculated with strain HK44 (designed here as PAH+, HK44+); lysimeters 3 and 5 (L3 and L5) contained clean, non-PAH contaminated soil and were inoculated with strain HK44 (PAH–, HK44+); and lysimeter 6 (L6) contained PAH-contaminated soil only (PAH+, HK44–) [12]. For the HK44+ lysimeters (L1, L2, L3, L4, and L5), each 10 cm increment of soil within a 92 cm treatment zone was sprayed with approximately 4 liters of strain HK44 cell suspension. For the PAH+ lysimeters (L1, L2, L4, and L6), a mixture of PAHs dissolved in transformer oil (1000 mg naphthalene/kg soil, 100 mg anthracene/kg soil, and 100 mg phenanthrene/kg soil) was applied to establish contaminated soil conditions similar to that of heavily contaminated manufactured gas plant sites [12]. All lysimeters then had a 61 cm of clean soil layered on top of the treatment zone. |
| In 2010, 14 years after initiation, these lysimeters were unsealed and sampled throughout the treatment zone as described by Layton et al. [16]. In order to capture both vertical and horizontal spatial variability, six soil cores (2.3 cm diameter) were taken from each lysimeter. The 61 cm clean soil layer above the treatment zone was discarded, leaving soil cores from the 92 cm treatment zone. These soil cores were fractionated into six 15 cm long sections. Due to soil compaction and low moisture, L4 and L6 could only be cored to 60 cm of the treatment zone, and were fractionated into four 15 cm long sections. Replicate sections from the same lysimeter and same depth were composited, yielding 32 discrete samples. Soil samples were stored at 4°C. |
| Soil chemical analyses |
| Soil moisture content was determined gravimetrically. Five grams of soil were dried to constant weight at 104°C and weighed to calculate soil moisture content. Soil total carbon, total nitrogen and organic matter content were determined on air dried and sieved (0.425 mm) soils. Total carbon and nitrogen was determined using a Carlo Erba combustion CN analyzer at the UT Soil, Plant and Pest Center (Nashville, TN). Soil organic matter (SOM) was determined by a loss on ignition method [17]. |
| Quantification of 16S rRNA and PAH degradation genes |
| DNA was extracted from the 32 composite soil samples using a FastDNA® SPIN Kit for soil (QBiogene, Morgan Irvine, CA) following the manufacturer’s instructions. DNA extractions were stored at -20°C. DNA concentrations were measured using a NanoDrop spectrophotometer (NanoDrop® ND-1000) and the fluorometrybased Quant-it PicoGreen (Invitrogen) dsDNA reagent and kits. PCR inhibition was assessed by amplifying 16S rRNA genes with universal bacterial primers 338F and 926R [18]. Each 25 μl PCR reaction contained 12.5 μl 2X PCR Master Mix (Fermentas Life Science), 0.4 μM of each primer, 1 μl soil total DNA extractions, and PCR clean water (Fermentas Life Science). The PCR reactions were performed on a Mastercycler® pro thermalcycler (Eppendorf) using the following protocol: 94°C for 2 minutes, then 35 cycles of denaturing at 94°C for 15 seconds, annealing at 50°C for 30 seconds, and extending at 72°C for 30 seconds, with a final extesion at 72°C for 1 minute after the 35 cycles. When no amplification product was produced under these conditions, templates were diluted with PCR clean water and reactions repeated until a product was successfully amplified. |
| The presence of PAH degradation genes was assessed using PCR amplification with two primer sets targeting PAH dioxygenase genes: DP1 and DP2 [6] and Ac114F and Ac596R [19], following the methods of the authors. Copies of bacterial 16S rRNA genes were enumerated by qPCR using universal bacterial primers 338F and 926R [18] as previously described [20]. |
| Amplicon library preparation and 454 sequencing |
| 16S rRNA gene amplicon libraries were prepared for each of the 32 samples according to the 454 recommended protocols (Roche). Extracted DNA was amplified with a primer that contained a unique multiplex identifier (MID) tag [21]. Each DNA sample was amplified on a Mastercycler® pro thermal cycler with their own optimal PCR conditions using 25 μl 2X Phusion® High-Fidelity PCR Master Mixes with high-fidelity buffer (Thermo Fisher Scientific Inc.), 0.4 μM unique barcoded 338F primer, 0.4 μM 926R primer 2 μl soil total DNA extractions, and PCR clean water (Fermentas Life Science) to make final reaction volumes equal to 50 μl. As a technical control, two soil samples from lysimeter 2 and lysimeter 4 were chosen and replicate libraries were constructed with two different sets of barcoded primers to determine the technical reproducibility of our library construction and sequencing. Ultimately, there were 34 16S rRNA gene libraries: 32 unique soil sample libraries plus 2 replicate libraries. Amplicons were purified using the Wizard DNA Cleanup Kit (Promega) following the manufacturer’s directions. Purified PCR products were quantified using the Quant-it Pico Green dsDNA quantification kit. Amplicons were then diluted to the same concentration and pooled together. The pooled amplicons were sequenced using titanium chemistry on a 454 Genome Sequencer FLX System (Roche) at the Joint Institute for Biological Sciences (Oak Ridge, TN). |
| Sequencing data analysis |
| Sequencing data were filtered through a quality control pipeline to identify and remove reads with errors using the open source software package “MOTHUR” Version 1.27.0 (http://www.mothur. org/) following the SOP (http://www.mothur.org/wiki/Schloss_SOP). Sequences were removed if they were less than 120 nucleotides long or contained more than eight homopolymers, more than 2 mismatches to primers, more than one mismatch to barcode sequences, or any ambiguous nucleotide. Sequences were aligned against the Silva bacterial database as a reference with a fixed starting position. Sequences within 2 bp difference of a more abundant sequence (considered to be PCR errors) were merged to the more abundant sequence as per Huse et al. [22]. Chimeric sequences were detected with the UCHIME algorithm [23] and removed. Non-bacterial sequences were removed. After quality control was completed, sequences were analyzed in two different ways: For operational taxonomic unit (OTU)-based analysis, sequences were clustered into OTUs using the standard of 97% similarity (approximately “species” level). For phylotype-based analysis, sequences were grouped at the genus level. We estimated α diversity for each library using the Chao1 richness estimator [24] and inverse Simpson diversity (1/D) [25]. ΘYC [26] was used to compare the community structures. |
| For community structure analysis and ordination, the 32 libraries were analyzed separately after using random subsampling to normalize sizes to the smallest library (n=323). Community structures of the 32 individual libraries were visualized using non-metric multidimensional scaling (NMDS) using the majorization algorithm. The analysis of similarity (ANOSIM) test was used to measure statistically significant differences between the treatments [27]. |
| For the remainder of the analyses, libraries from within a single lysimeter were merged into one library and random subsampling was used to normalize library size to the smallest library (n=3564). This yielded n=6 libraries, one for each lysimeter, which were used for α diversity calculations and taxonomic analyses. Raw sequence data for each lysimeter is available in MG-RAST (# 4527388.3, 4527389.3, 4527390.3, 4527391.3, 4527392.3, 4527393.3). |
| Statistical analyses |
| For pairwise means comparisons, a non-parametric Mann– Whitney U test was used to estimate whether there were significant differences between two groups. For multiple means comparison, a nonparametric Kruskal-Wallis one way analysis of variance was used. For comparisons that showed differences between groups, the post hoc means comparison Tukey’s studentized range (HSD) test using ranked data was implemented to determine the significantly different groups. Correlations between parameters were calculated using the nonparametric Spearman’s Rank Correlation analysis. For all, a p<0.05 was considered statistically significant. |
| Results |
| Soil chemistry |
| Soil samples were taken throughout the treatment zone of each lysimeter. The mean gravimetric soil moisture content of the six lysimeters (L1, L2, L3, L4, L5, L6) were 19.1%, 24.6%, 24.8%, 9.71, 13.3%, 8.02%, respectively. Failing seals on L4 and L6 had resulted in drier soils at the time of sampling. Soil organic matter (SOM) (Figure 1) and soil total carbon, total nitrogen and C:N ratios (Table 1) were measured for each of the 32 samples and the means for each lysimeter calculated. Although PAHs were no longer detectable, soils from the PAH-contaminated lysimeters (L1, L2, L4, and L6) had significantly higher SOM (Mann-Whitney U test, Z=–4.519, p<0.001), total carbon (Z=–3.202, p=0.001), total nitrogen (Z=–2.225, p=0.026), and C:N ratios (Z=–3.199, p=0.001) compared to soils in lysimeters that were not originally contaminated (L3 and L5). These results show that even after 14 years, soil chemistry remained altered. In contrast, the addition of HK44 to PAH contaminated soils did not have an effect as there was no significant difference between lysimeters with (L1, L2, and L4) and without (L6) an HK44 inoculum in terms of SOM (Z=1.055, p=0.291), total carbon (Z=0.000, p=1.000), total nitrogen (Z=0.556, p=0.578), or C:N ratio (Z=0.079, p=0.937). |
| Bacterial abundances |
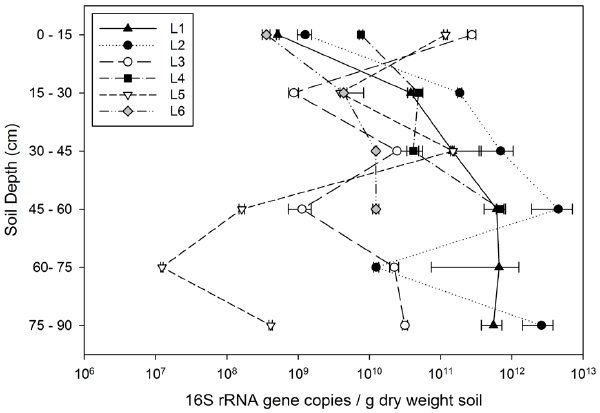
| As a proxy for total soil bacterial abundances, bacterial 16S rRNA genes were quantified using quantitative PCR (Figure 2). Soils from PAH-treated lysimeters (L1, L2, L4, and L6) had significantly higher abundances of 16S rRNA gene copies than the PAH– group (Z=–2.394, p=0.017). The 16S rRNA gene concentrations between treatments that were and were not inoculated with HK44 showed no significant differences (Z=–1.225, p=0.221). Bacterial abundances were significantly correlated with SOM (rs=0.62, p<0.001, n=32) and nitrogen (rs=0.63, p=0.008, n=16), but not significantly correlated to carbon (rs=0.11, p=0.70, n=16). |
| Bacterial community composition |
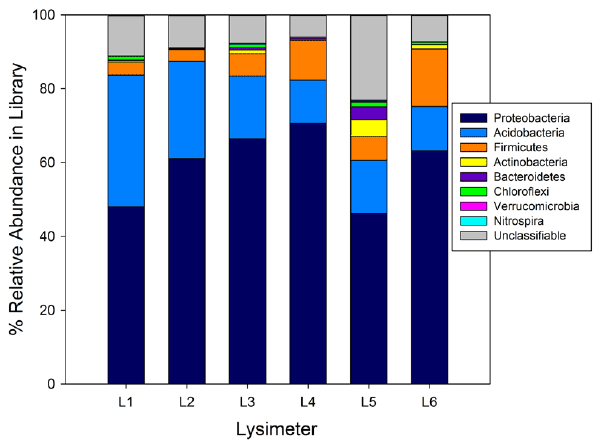
| Sequencing of the 16S rRNA genes revealed that the most abundant phyla in the lysimeters were Acidobacteria, Firmicutes, and Proteobacteria (Figure 3). Phyla Chlamydiae, Chlorobi, Planctomycetes, Deinococcus-Thermus, Gemmatimonadetes, OP11, and TM7 were detected at relative abundances of <0.2%. |
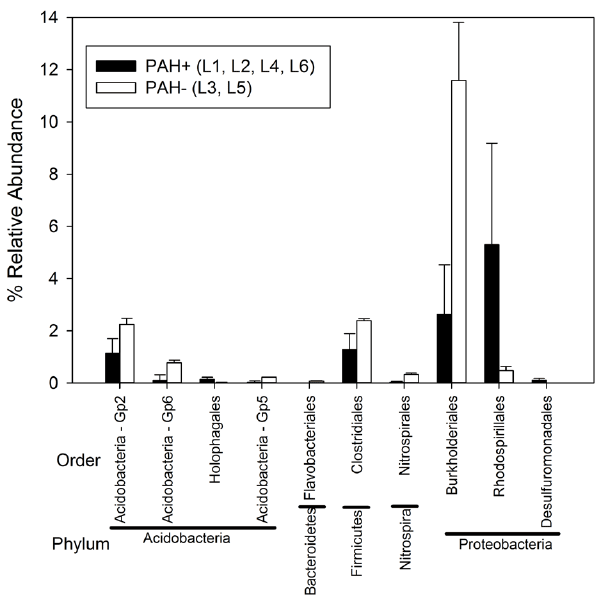
| In the lysimeters originally treated with PAHs (L1, L2, L4, and L6), there were significantly greater relative abundances of bacteria belong to orders Holophagales (Phylum Acidobacteria), Rhodospirillales (α-Proteobacteria) and Desulfuromonadales (δ-Proteobacteria) compared to untreated lysimeters L3 and L5 (Figure 4). There were significantly lower relative abundances of bacteria belonging to Acidobacteria orders Gp2, Gp5, and Gp6, as well as Flavobacteriales (Bacteroidetes), Clostridiales (Firmicutes), Nitropirales (Nitrospira) and Burkholderiales (β-proteobacteria) in PAH treated lysimeters L1, L2, L4, and L6 (Figure 4). There were no significant differences in the relative abundance of any taxa between lysimeters that were inoculated (L1, L2, L3, L4, and L5) or not inoculated (L6) with HK44. |
| The order Pseudomonadales made up 1.02% of all sequences and was detected in all lysimeters. However, P. fluorescens HK44-specific sequences were not found. The Pseudomonas spp. sequences most closely related to HK44 were recovered from L3 and L5, and had only 98.99% and 97.76% identity to HK44. In addition, other PAH dioxygenase genes were not detected by PCR amplification: primers targeting the alpha subunits of a diversity of dioxygenase genes did not yield any amplicons, indicating <400 gene copies per gram soil (data not shown). These results suggest that HK44, if it is still present in the lysimeter soils, is at very low abundances (i.e., <0.02 % of the bacterial community). |
| Alpha diversity |
| Estimates of richness (Chao1) and diversity (Simpson’s Index) for each lysimeter are listed in Table 2. These estimates were made at both the OTU (97% rRNA similarity) and genus level (matches taxonomic groups at the genus level). Richness was comparable between all lysimeters at both the OTU and genus levels, ranging from 1343 to 1999 OTUs and 95 to 137 genera. Lysimeter 3 had a lower calculated diversity compared to the other lysimeters, however there was no significant difference in diversity between treatments. |
| Bacterial community structure |
| Replicate lysimeters receiving identical treatments shared, on average, 12.34 ± 1.62 % of OTUs. When comparing the treatments, it was found that the greatest differences were between PAH amended lysimeters (L1, L2, L4, and L6) and unamended (L3 and L5): PAH amended lysimeters shared only 7.68 ± 2.08 % of OTUs with non- PAH amended lysimeters. Lysimeters inoculated with HK44 (L1, L2, L3, L4, and L5) shared an average of 10.15 ± 1.79 % OTUs with un-inoculated lysimeter L6. |
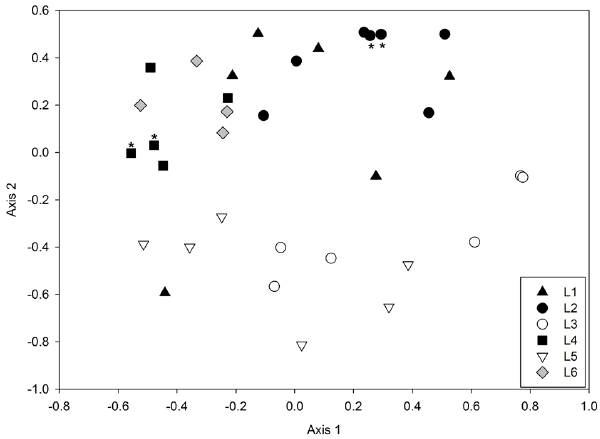
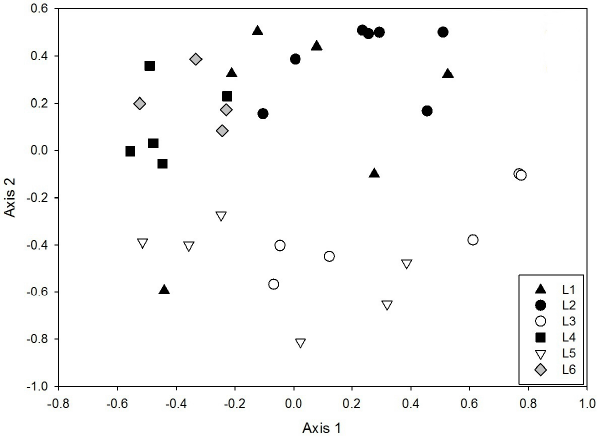
| Community structures were compared for the 32 individual libraries in order to assess the variability in community structure within and between lysimeters. ΘYC dissimilarities [26] were calculated, which take into account both membership and relative abundance of OTUs. Technical replication of the libraries was good: distances between replicate libraries from the same sample were less than distances between samples (Figure 5). The ΘYC dissimilarities between the replicate libraries were 0.06 (L2) and 0.14 (L4), while the mean dissimilarities within a lysimeter was 0.47 (L2) and 0.52 (L4), and the mean dissimilarity between lysimeters was 0.79. Nonmetric multidimensional scaling (NMDS) plots (Figure 5) revealed a clear partitioning of communities between those that received PAH amendments (black, grey) and those that did not (white). ANOSIM confirmed that the PAH+ cluster (L1, L2, L4, L6) was significantly different from the PAH- cluster (L3, L5) (R=0.487, p<0.001). There was no significant difference between the HK44+ lysimeters and the lysimeter which was not inoculated (L6) (R=-0.145, p=0.809). |
| It is notable that within the cluster of PAH+ and HK44+ libraries (Figure 5, black and grey), there is a significant separation between L1, L2 and L4, L6 (R=0.4532, p<0.001). We believe this could be due to slight differences in soil moisture caused by failing seals on the lysimeters. L1 and L2 had slightly higher soil moisture content (mean 19.1 % and 24.6 %, respectively) than L4 and L6 (9.7 % and 8.0 %, respectively) at the time of sampling. Taxa that were present in significantly greater abundances in the drier lysimeters (L4 and L6) compared to L1 and L2 included Bacillales (Firmicutes), Clostridiales (Firmicutes), and Rhizobiales (α-Proteobacteria). Taxa that had significantly higher relative abundances in the moister lysimeters (L1 and L2) compared to L4 and L6 included Acidobacter Gp1, Burkholderiales (β-Proteobacteria), and Caulobacterales (α-Proteobacteria). Thus, it appears that after the organic addition, soil moisture may act as a secondary influence on soil microbial community structure. |
| Discussion |
| It is well established that the addition of PAHs can cause shifts in bacterial communities in terms of both membership (taxa present) and structure (membership and relative abundance of taxa). Since a subset of the resident soil microbes can use PAHs as a growth substrate, the addition of PAHs imposes a selective pressure on the soil bacterial community [15]. Margesin et al. [28] reported that the biomass C, N and the proportion of hydrocarbon degrading bacteria increased rapidly after hydrocarbon addition. However, most studies investigating the impact of PAHs on bacterial communities cover only relatively short terms (<1 year) and focus on soils in which the PAH concentrations were still detectable [5,6,10,29]. Here we investigated soils 14 years post-contamination, in which the soils have been free of the selective pressure of PAHs for approximately 12 years. In addition to the impact of PAHs, this study also evaluated the effects of an introduced HK44 population to provide a rare opportunity to evaluate the long term combined impact of both PAHs and recombinant microorganisms on native soil bacterial communities. |
| Although PAH concentrations were below detectable limits after 2 years, we observed a long term effect on soil chemistry and soil microbial community structures. Fourteen years after a one time PAH contamination event, soil organic matter, total carbon, total nitrogen and bacterial abundances were all significantly elevated compared to the uncontaminated lysimeters. Bacterial community richness and diversity were not significantly different between treatments, and the overall phyla distribution was quite similar. We did, however, observe a clear difference in the soil bacterial community membership and structure at the genus and OTU (97% similarity) level between PAH-contaminated and uncontaminated lysimeters. Thus it appears that even long after contaminants are removed; there can be lasting effects on the native soil bacterial communities. This is an important consideration for bioremediation efforts in which the goal is to return the environment to its original pristine state. This study reveals an overlooked aspect of bioremediation – while contaminants were long removed, the soil was still significantly different from uncontaminated soils over a decade later. Microbial communities, like macrobiotic communities, are proposed to respond to disturbances in several ways, vis a vis Allison and Martiny [30]. Our observations here suggest that these communities were not resistant to the perturbation of PAH addition and have experienced a “permanent” change (at least over this time period) in community structure. |
| The dominant taxa in our libraries belonged to phyla Acidobacteria, Firmicutes, and Proteobacteria. This is not surprising considering these are common soil phyla [31] and many of the isolated PAH-biodegradative strains belong to these phyla [5,32]. Bacterial communities from PAH contaminated soils and sediments are often dominated by Proteobacteria, either in terms of abundance [10,29] or function [6,7,33]. While we detected Pseudomonas in the HK44- innoculated lysimeters, they did not correspond to P. fluorescens HK44; this corroborates Layton et al. [16] who were unable to detect HK44 nahA naphthalene dioxygenase genes in these lysimeters. Interestingly, we also did not detect any PAH dioxygenase genes using two different primer sets, suggesting that biodegradative organisms were not dominant in these communities. |
| In contrast to the effect of PAHs, inoculation of the bioluminescent bioreporter HK44 had no discernible long term impact on soil chemistry or native soil bacterial communities. Not only was HK44 not found in these lysimeters by us or Layton et al. [16], we have also demonstrated that there were no significant changes in bacterial communities in terms of abundance (16S rRNA gene quantities), richness, diversity or community structures. In terms of the parameters measured here, it can be concluded that the release of a genetically modified organism had no long term impact on the soil or the bacterial community structure. It is possible that strain HK44 was not as competitive as the indigenous bacteria, due to the added genetic load or loss of fitness after generations of adaptation to lab conditions. |
| In this study PAH contamination had the dominant impact on bacterial community structures, but soil moisture may have exerted a secondary influence: there was a slight divergence between community structures in L1 and L2 (higher moisture) and L4 and L6 (lower moisture). This separation was not apparent in any of the other parameters measured. Responses to changes in soil moisture can vary between taxonomic groups [20,34], and can result in community structure changes [10,35], so it is plausible that the differences observed were due to differences in soil moisture. Because the moisture differences were due to faulty seals, it is unknown at what time point the soil moisture content of these lysimeters became dissimilar. |
| In summary, this study revealed that long after PAHs are removed from soils there can be a lasting impact on soil organic matter content and microbial community abundances and structures. In contrast, the inoculation of a genetically modified microorganism had no apparent long term impact on native soil microbial communities. |
| Acknowledgements |
| This work was funded by startup funds provided to JMD by University of Tennessee AgResearch, by University of Tennessee Microbiology across Campuses Educational and Research Venture (M-CERV), and by USDA National Institute of Food and Agriculture Biotechnology Risk Assessment Program under grant number 2009-39210-20230. Thanks to Dan Williams and Scott Moser at the Center for Environmental Biotechnology (UT) for lysimeter sampling. |
References
- Cerniglia CE (1992) Biodegradation of polycyclic aromatic hydrocarbons. Biodegradation 3: 351-368.
- Bamforth SM, Singleton I (2005) Bioremediation of polycyclic aromatic hydrocarbons: Current knowledge and future directions. J Chem Technol Biot 80: 723-736.
- Juhasz AL, Naidu R (2000) Bioremediation of high molecular weight polycyclic aromatic hydrocarbons: a review of the microbial degradation of benzo a pyrene. Int Biodeterior Biodegrad 45: 57-88.
- Jones KC, Stratford JA, Tidridge P, Waterhouse KS, Johnston AE (1989) Polynuclear aromatic hydrocarbons in an agricultural soil: long-term changes in profile distribution. Environ Pollut 56: 337-351.
- Lors C, Ryngaert A, Périé F, Diels L, Damidot D (2010) Evolution of bacterial community during bioremediation of PAHs in a coal tar contaminated soil. Chemosphere 81: 1263-1271.
- Ní Chadhain SM, Norman RS, Pesce KV, Kukor JJ, Zylstra GJ (2006) Microbial dioxygenase gene population shifts during polycyclic aromatic hydrocarbon biodegradation. Appl Environ Microbiol 72: 4078-4087.
- Debruyn JM, Sayler GS (2009) Microbial community structure and biodegradation activity of particle-associated bacteria in a coal tar contaminated creek. Environ Sci Technol 43: 3047-3053.
- Uyttebroek M, Spoden A, Ortega-Calvo JJ, Wouters K, Wattiau P, et al. (2007) Differential responses of eubacterial, Mycobacterium, and Sphingomonas communities in polycyclic aromatic hydrocarbon (PAH)-contaminated soil to artificially induced changes in PAH profile. J Environ Qual 36: 1403-1411.
- Muckian L, Grant R, Doyle E, Clipson N (2007) Bacterial community structure in soils contaminated by polycyclic aromatic hydrocarbons. Chemosphere 68: 1535-1541.
- Vinas M, Sabate J, Espuny MJ, Solanas AM (2005) Bacterial community dynamics and polycyclic aromatic hydrocarbon degradation during bioremediation of heavily creosote-contaminated soil. Appl Environ Microbiol 71: 7008-7018.
- Margesin R, Labbé D, Schinner F, Greer CW, Whyte LG (2003) Characterization of hydrocarbon-degrading microbial populations in contaminated and pristine Alpine soils. Appl Environ Microbiol 69: 3085-3092.
- Ripp S, Nivens DE, Ahn Y, Werner C, Jarrell J, et al. (2000) Controlled field release of a bioluminescent genetically engineered microorganism for bioremediation process monitoring and control. Environ Sci Technol 34: 846-853.
- Ripp S, Nivens DE, Werner C, Sayler GS (2000) Bioluminescent most-probable-number monitoring of a genetically engineered bacterium during a long-term contained field release. Appl Microbiol Biotechnol 53: 736-741.
- King JM, Digrazia PM, Applegate B, Burlage R, Sanseverino J, et al. (1990) Rapid, sensitive bioluminescent reporter technology for naphthalene exposure and biodegradation. Science 249: 778-781.
- Trögl J, Kuncová G, Kubicová L, Parík P, Hálová J, et al. (2007) Response of the bioluminescent bioreporter Pseudomonas fluorescens HK44 to analogs of naphthalene and salicylic acid. Folia Microbiol (Praha) 52: 3-14.
- Layton AC, Smartt AE, Chauhan A, Ripp S, Williams DE, et al. (2012) Ameliorating risk: culturable and metagenomic monitoring of the 14 year decline of a genetically engineered microorganism at a bioremediation field site. Bioremed Biodegrad S1: 0-9.
- Bendor E, Banin A (1989) Determination of organic-matter content in arid-zone soils using a simple loss-on-ignition method. Commun Soil Sci Plant Anal 20: 1675-1695.
- Burke DJ, Kretzer AM, Rygiewicz PT, Topa MA (2006) Soil bacterial diversity in a loblolly pine plantation: influence of ectomycorrhizas and fertilization. FEMS Microbiol Ecol 57: 409-419.
- Stach JE, Burns RG (2002) Enrichment versus biofilm culture: a functional and phylogenetic comparison of polycyclic aromatic hydrocarbon-degrading microbial communities. Environ Microbiol 4: 169-182.
- DeBruyn JM, Nixon LT, Fawaz MN, Johnson AM, Radosevich M (2011) Global biogeography and quantitative seasonal dynamics of Gemmatimonadetes in soil. Appl Environ Microbiol 77: 6295-6300.
- Hamady M, Walker JJ, Harris JK, Gold NJ, Knight R (2008) Error-correcting barcoded primers for pyrosequencing hundreds of samples in multiplex. Nat Methods 5: 235-237.
- Huse SM, Welch DM, Morrison HG, Sogin ML (2010) Ironing out the wrinkles in the rare biosphere through improved OTU clustering. Environ Microbiol 12: 1889-1898.
- Edgar RC, Haas BJ, Clemente JC, Quince C, Knight R (2011) UCHIME improves sensitivity and speed of chimera detection. Bioinformatics 27: 2194-2200.
- Colwell RK, Coddington JA (1994) Estimating terrestrial biodiversity through extrapolation. Philos Trans R Soc Lond B Biol Sci 345: 101-118.
- Simpson EH (1949) Measurement of diversity. Nature 163: 688-688.
- Yue JC, Clayton MK (2005) A similarity measure based on species proportions. Commun Stat-Theory Methods 34: 2123-2131.
- Clarke KR (1993) Nonparametric multivariate analyses of changes in community structure. Aust J Ecol 18: 117-143.
- Margesin R, Zimmerbauer A, Schinner F (2000) Monitoring of bioremediation by soil biological activities. Chemosphere 40: 339-346.
- Andreoni V, Cavalca L, Rao MA, Nocerino G, Bernasconi S, et al. (2004) Bacterial communities and enzyme activities of PAHs polluted soils. Chemosphere 57: 401-412.
- Allison SD, Martiny JB (2008) Colloquium paper: resistance, resilience, and redundancy in microbial communities. Proc Natl Acad Sci U S A 105: 11512-11519.
- Janssen PH (2006) Identifying the dominant soil bacterial taxa in libraries of 16S rRNA and 16S rRNA genes. Appl Environ Microbiol 72: 1719-1728.
- Haritash AK, Kaushik CP (2009) Biodegradation aspects of polycyclic aromatic hydrocarbons (PAHs): a review. J Hazard Mater 169: 1-15.
- Debruyn JM, Chewning CS, Sayler GS (2007) Comparative quantitative prevalence of Mycobacteria and functionally abundant nidA, nahAc, and nagAc dioxygenase genes in coal tar contaminated sediments. Environ Sci Technol 41: 5426-5432.
- Aanderud ZT, Lennon JT (2011) Validation of heavy-water stable isotope probing for the characterization of rapidly responding soil bacteria. Appl Environ Microbiol 77: 4589-4596.
- Drenovsky RE, Steenwerth KL, Jackson LE, Scow KM (2010) Land use and climatic factors structure regional patterns in soil microbial communities. Glob Ecol Biogeogr 19:27-39.
Tables and Figures at a glance
| Table 1 | Table 2 |
Figures at a glance
 |
 |
 |
| Figure 1 | Figure 2 | Figure 3 |
 |
 |
 |
| Figure 4 | Figure 5 | Figure 6 |
Relevant Topics
- Anaerobic Biodegradation
- Biodegradable Balloons
- Biodegradable Confetti
- Biodegradable Diapers
- Biodegradable Plastics
- Biodegradable Sunscreen
- Biodegradation
- Bioremediation Bacteria
- Bioremediation Oil Spills
- Bioremediation Plants
- Bioremediation Products
- Ex Situ Bioremediation
- Heavy Metal Bioremediation
- In Situ Bioremediation
- Mycoremediation
- Non Biodegradable
- Phytoremediation
- Sewage Water Treatment
- Soil Bioremediation
- Types of Upwelling
- Waste Degredation
- Xenobiotics
Recommended Journals
Article Tools
Article Usage
- Total views: 16575
- [From(publication date):
September-2013 - Apr 02, 2025] - Breakdown by view type
- HTML page views : 11822
- PDF downloads : 4753
