Climate Change Vulnerability Assessment: Approaches DPSIR Framework and Vulnerability Index
Received: 25-Nov-2011 / Accepted Date: 21-Jan-2012 / Published Date: 23-Jan-2012 DOI: 10.4172/2157-7617.1000109
Abstract
Climate change is a reality. The effects of climate change are observed in every continent and in all sectors. These changes do not occur in isolation and often reflect changes in the global markets that may amplify or dampen the importance of the environmental challenges. Vulnerability refers to the potential of a system to be harmed by an external stress. This paper shows two different vulnerability assessment indexes: the Livelihood Vulnerability Index (LVI) and the Livelihood Effect Index (LEI). Both indexes validly reflect the relative difference in terms to examining the vulnerability index of climate change and both could usefully form the basis for a nationally applicable index to identify and prioritize adaptation and mitigation needs. The Drivers-Pressures-State-Impact-Response (DPSIR) framework has evolved into an interdisciplinary tool for environmental analyses and assumes cause-effect relationship between interacting component of social, economic, and environmental systems. The DPSIR framework helps in identifying the indicators of (LVI) and (LEI) vulnerability index as cause-effect relationship. The DPSIR framework also provides the feedback of cause-effect continuous process which will be helpful in developing the capacities to cope or adapt to the vulnerability as responses factor.
Keywords: Climate Change; Vulnerability; Assessment; Framework; ulnerability Index
5385Introduction
Vulnerability assessment describes a diverse set of methods used to systematically integrate and examine interactions between humans and their physical and social surroundings. The field of climate vulnerability assessment has emerged to address the need to quantify how communities will adapt to changing environmental conditions. Various researchers have tried to bridge the gap between the social, natural, and physical sciences and contributed new methodologies that confront this challenge [1]. Many of these rely heavily on the IPCC working definition of vulnerability, a function of exposure, sensitivity, and adaptive capacity [2].
As mentioned in Section 2.3, the IPCC Third Assessment Report [2] described vulnerability as “a function of the character, magnitude and rate of climate variation to which a system is exposed, its sensitivity, and its adaptive capacity”. It defined vulnerability as “the degree to which a system is susceptible to or unable to cope with, adverse effects of climate change, including climate variability and extremes”. Vulnerability to impacts is a multi-dimensional concept, encompassing bio-geophysical, economic, institutional and socio-cultural factors. Vulnerability is usually considered to be a function of a system’s ability to cope with stress and shock [3].
Vulnerability = ƒ (Exposure, Sensitivity, Adaptive capacity)
In the context of climate change, vulnerability is a function of the character, magnitude and rate of climate variation to which a system is exposed, people’s sensitivity and their adaptive capacity. Exposure could include geographical location, especially related to high exposure to risks (i.e., people living in the areas of natural disasters such as drought or coastal areas and river basins affected by floods) [4].
Sensitivity and adaptive capacity are context-specific and vary from country to country, from community to community, among social groups and individuals, and over time in terms of its value, but also according to its nature. Finally, adaptive capacity depends on access to resources that could help in responding to threats and exposures (i.e., functioning community networks, access to low-rate loans, accessible services such as health care and sanitation, irrigation systems and water storage, etc.). The system’s adaptive capacity i.e., the ability of a system to adjust with climate change to moderate potential damages, to take advantage of opportunities or to cope with the consequences then determines its vulnerability to these potential impacts.
Impacts of climate change pose very serious risks for countries, vital ecosystems, and other sectors including agriculture, forestry, health, local economic activities and biodiversity. In conjunction with other pressures, they could also exacerbate other serious local and regional challenges, such as poverty, poor healthcare, inequitable distribution of resources, diminishing ecological resiliency and energy insecurity. Global changes mainly, occur from anthropogenic emissions of greenhouse gases, such as carbon dioxide that results from the burning of fossil fuels, methane and nitrous oxide from multiple human activities. Vulnerability and adaptation assessments help to minimize the adverse impacts by means of deriving adaptation or mitigation strategies.
Reducing the adverse impacts of climate change requires both mitigation and adaptation efforts. Indeed even if CO2 emissions are stabilized at Kyoto levels, the planet would experience warming for the next 100 years [5] and require the implementation of adaptation measures. Climate change impacts will affect social and ecological systems in complex and broad-ranging ways as technological, economic, social and ecological changes take place across regions, groups and sectors. This article seeks to assess the vulnerability assessment with two different indexes as Livelihood Vulnerability Index and Livelihood Effect Index. This article also describes the key approaches of DPSIR framework to help in assessing vulnerability indicators of both indexes and significantly important in determining the climate change impact and policy responses.
Vulnerability Assessment: Vulnerability Index
The vulnerability index compiles with dimensions and sub dimensions of each indicator. The climate change indicators are divided into mainly two indexes; Livelihood Vulnerability Index (LVI) and Livelihood Effect Index (LEI). The LVI developed by Hahn et al. [6] is reflecting the IPCC [2] that contributing the factors of vulnerability into three indicators and its seven dimensions: socio-demographic profile, livelihood strategies, social networks, health, food, water, and natural disasters and climate variability of adaptive capacity, sensitivity and exposure (Table 1).
| Indicators | Dimensions | Sub-dimensions |
|---|---|---|
| Adaptive Capacity | Socio-demographic profile | Dependency ratio |
| Percentage of female headed household | ||
| Livelihood strategies | Percentage of household with orphans | |
| Percent of households dependent solely on agriculture as income source |
||
| Social network | Percent of households dependent solely on agriculture as income source | |
| Average agricultural Livelihood Diversification Index | ||
| Sensitivity | Health | Average time to nearest health centre |
| Percent of households with family member with chronic illness | ||
| Food | Percent of households dependent solely on family farm for food |
|
| Percentage of households struggle to find food to support whole year |
||
| Water | Percentage of households reported to have water availability problem |
|
| Percent of households that utilize a natural water source | ||
| Exposure | Natural disaster and Climate variability | Percentage of households reporting injury or death of a family member due to climate related disaster |
| Percentage of households reported their natural resource base reduced |
Table 1: Climate change effect indicators in Livelihood Vulnerability Index (LVI).
The LVI constructs a balanced weighted average where each sub-dimensions contributes equally to the overall index. Each of the sub-dimensions is measured on a different scale; therefore, first standardized as an index using [6].
Indexsv= Sv - Smin / Smax - Smin (1)
Where Sv: the dimension value of each indicator; Smax and Smin: the maximum and minimum sub-dimensions values determined dimension
After standardization the value of each dimension is calculated using
 (2)
(2)
Where Mv: one of the seven major dimensions; Indexsvi: the subdimension value of each indicator i belonging to major dimension Mv ; n: the number of sub-dimensions in each major dimension
The LVI is scaled from 0 (least vulnerable) to 1 (most vulnerable).
The LVI is calculated as the weighted average of the seven major dimensions
 (3)
(3)
Where LVIv: the Livelihood Vulnerability Index; Mvi: the value of the ith major dimension; WMi: the weight of major dimension i, decided by the number of sub-dimensions in the major dimension.
The LEI is participating with the index values of natural, human social, financial and physical capital (Table 2). Downing et al. [7] state that vulnerability indicators can help identify and target vulnerable regions, sectors or populations, raise awareness, and be part of a monitoring strategy. Vulnerability indicators have been defined based on spatial (physical) and non-spatial (social and economic) elements that configure the urban form and have potentiality for risk. They have been classified into three classes: physical, economic and social vulnerability indicators. Adger [8] distinguish between generic and specific vulnerability indicators. Both the LVI and the LEI provide a community based composite index, while the LEI also provides a household based composite index.
| Indicators | Dimensions | Sub-dimensions |
|---|---|---|
| Human capital | Health | Percentage of households having reductions in nutrition |
| Percentage of households having loss of life, injury or new diseases | ||
| Inverse of Life Expectancy | ||
| Percentage of households having public safety problems from forest/wild fire | ||
| Food | Average food insufficient months | |
| Inverse of crop diversification index | ||
| Knowledge and Skills | Inverse of education index | |
| Percentage of households do not having electronic appliances at home | ||
| Percentage of households where a family member has not taken any kind of vocational training | ||
| Natural capital | Land | Inverse of Land Productivity Index |
| Percentage of households having land degradation/crop loss or reduction in crop production by climate related extremes | ||
| Forest | Percentage of households using only Forest-based energy for cooking purpose | |
| Average time to fetch firewood | ||
| Water | Percentage of households that collect water directly from river, streams, pond | |
| Percentage of households that do not have daily water supply | ||
| Average time to fetch water | ||
| Inverse of water storage index | ||
| Climate Variability and Natural Disasters |
Average number of flood, drought and avalanches during last 10 years | |
| Mean standard deviation of daily mean average maximum and minimum temperature by month | ||
| Mean standard deviation of daily precipitation by month | ||
| Social capital | Demographic | Average family member in a households |
| Percent of households where head of household has not attended school | ||
| Network and Relationship | Percentage of households received helps from their social networks to cope up with climate change | |
| Percentage households had to receive help through social networks | ||
| Percent of households that have not gone to local government for any kind of assistance in past 12 months | ||
| Percent of respondents who have not voted in election | ||
| Financial capital | Assets | Inverse of Average land holding index |
| Inverse of average agriculture livelihood diversification index | ||
| Finance | Inverse of income index | |
| Percentage of households reported to have some sort of financial crisis | ||
| Percent of households who do not have access to financial services to any financial institution | ||
| Percent of households who do not have any family members working outside the village at relatively developed place | ||
| Physical capital | Road and Communication | Average time to reach nearest vehicle station |
| Average time to reach nearest communication centre | ||
| Daily needs | Percentage of households reported loss from dairy and livestock production | |
| Percentage of households having losses to housing or property | ||
| Percentage of households reported their natural water source is depleting |
Table 2: Climate change effect indicators in Livelihood Effect Index (LEI).
Percentage values of each effect indicator obtained from the household questionnaire were first standardized using equation 1 (minimum: 0, maximum: 100) and then used to calculate the index values for each capital (natural, human, social, financial and physical) by using
 (4)
(4)
Where Cv: the value for each capital of LEI; li: the effect dimension value for capital I; n: the number of sub-dimensions forming the capital.
The LEI is scaled from 0 (least effected) to 1 (most effected). The LEI is calculated as the weighted average of all capitals using
 (5)
(5)
Where LEIv: the Livelihood Effect Index; Cvi: the value of capital I; Wi: the weight of each capital, decided by the number of dimensions in the each indicators.
Methods for assessing vulnerability include historical narratives, statistical analysis, Geographic Information System (GIS), mapping techniques, and comparative analysis. These two indexes aim to map vulnerability in various sectors as Agricultural Vulnerability Index (AVI), Forest Vulnerability Index (FVI), Water Vulnerability Index (WVI), Livelihood Vulnerability Index (LVI), Climatic Vulnerability Index (CVI), Socio-economic Vulnerability Index (SVI) and Poverty Vulnerability Index (PVI). The dynamics of vulnerability are captured by relating it to climate change, adaptation to climate change, impacts of climate change, natural hazards and responses and social indicators.
Vulnerability Assessment: DPSIR Framework
Indicators are used by the EEA [9] to assess the overall condition of the environment by means of the driver-pressure-state-impact response (DPSIR) framework. This causal framework describes the interactions between society and the environment and is an extension of the PSR model developed by the OECD to standardize the use of indicators of environmental performance. The PSR framework describes how human activity exerts pressure on the environment for example, the emission of greenhouse gases. Consequently, the state of the environment is altered resulting in a change for example, mean temperature of greenhouse gas concentration in the atmosphere. Response in this case, describes social response and not ecosystem response and may result in modifications to environmental policy, such as the adaptation in response to any changes. In addition, the EEA [9] have extended the PSR framework to include indicators of the drivers of climate change such as consumption pattern and indicators of the Impact of climate change on ecosystems and human health. The DPSIR framework has been used in the Millennium Ecosystem Assessment (MEA) for the global assessment and organizing information about the complex chain of cause-and-effect in the interactions between society and the environment and consists of several components. A DPSIR framework can be useful in helping to identify priorities and find the most efficient response measures. The attraction of the DPSIR is that it draws attention to drivers and pressures at various scales which are affecting livelihoods in a locality.
The DPSIR framework is widely used in the fields of global change, ecosystem research sustainable science and quality of life are interlinked. Driving forces refer to economic, technological, social and even natural factors that shape human activities exerting pressures on the environment. The pressures are the specific ways that human activities lead to changes in the state of the environment and impacts on valued parts of ecosystems or on society. Impacts may trigger responses from regulating authorities or the private sector. The integrating principles of vulnerability assessment with available information on current climate change into the DPSIR framework helps to develop adaptation responses that are relevant to other socio-economic and environmental challenges.
The DPSIR framework addresses the changes happening and the trends associated with environment. The climate change-related components of Driving Force are industrial activities, energy demand, consumption patterns, pressures on natural processes, changes in agricultural production and increased CO2 emissions. State factor of the environment increased the occurrence of cyclones, drought, floods, changes in physical or biological components of the Earth’s system, Impacts on the ecosystem, welfare of human beings as water security and food security. The responses need to be crafted to minimize the impact of the drivers and pressures on ecosystems and maximize the welfare of human beings by adaptation and mitigation phenomenon (Figure 1).
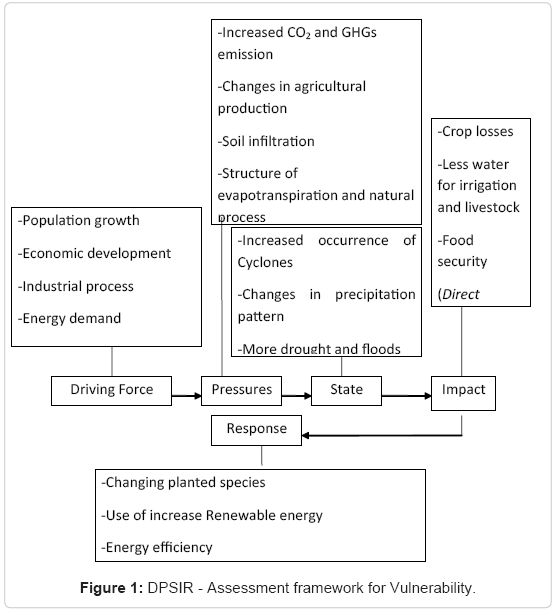
Figure 1: DPSIR - Assessment framework for Vulnerability.
The vulnerability is wide-ranging, which includes natural, social, economic and demographic data, such as floods, earthquakes, GDP and population distribution. The vulnerability is used in analyses of land use and land-use changes, as well as estimates of costs and benefits, direct and indirect climate impacts and policy measures. Other factors are less tangible yet equally important in assessing the human and social capital, institutional capacity, governance structures as well as cultural factors, such as traditional norms of reciprocity and cooperation.
The first area of vulnerability research deals with Natural vulnerability such as earthquakes, cyclones, or floods. More recently, the Tohoku earthquake and Tsunami, namely the Eastern Japan Great Earthquake Disaster, was caused by a 9.0-magnitude undersea mega thrust earthquake off the coasts of Japan that occurred at 14:46 JST on Friday, March 11, 2011. The earthquake triggered extremely destructive Tsunami waves of up to 37.9 meters (124 ft) that struck Japan minutes after the quake, in some cases traveling up to 10 km inland with smaller waves reaching many other countries after several hours [10].
The second area of vulnerability research lies within the Socioeconomic vulnerability which involves the people who are living under the poverty line, wealth loses, economical and material loses. Gender also affects social vulnerability. Women are more vulnerable than men are to disasters, mainly because women— especially single mothers — are more likely to live in poverty. Women often suffer the impacts of a disaster disproportionately. The socioeconomic assessment highlights the differential exposure to climate threats of regions, countries, locales and communities with different socio-economic endowments.
Vulnerability to Climate Change: Key Drivers
The climate change key drivers impact on freshwater resources which are identified by insufficient water resource management capacity with rapid economic and population growth. The extremely vulnerability is due to the flooding events, owing to their densely populated environments, that provide homes to often migrant and unregistered population settled in inadequate housing. Increases in aridity, as a result of declining rainfall and/or rising temperatures, are the key concern of severe impacts on both terrestrial and freshwater systems. Freshwater systems are particularly vulnerable to increase in the frequency and intensity of extreme events (droughts or floods), even if average conditions are unchanged. The biodiversity of isolated tropical, subtropical, and warm-temperate mountains may be particularly vulnerable to warming, because many species already have small geographical ranges that will shrink further under global warming [11-14].
The coastal system and low lying areas appear to be most vulnerable to rising water temperatures, plus the impacts of ocean acidification, particularly for calcifying organisms such as corals. Coastal erosion is threatening critical contaminated sites, with potential for spreading of pollutants [15]. Vulnerability of rainfed agriculture is expected to increase with decreasing precipitation. Rapid population growth will raise food demand, and its impact on governmental decision, such as land policies, improvements in agricultural technologies and market oriented land-management, which can affect the efficiency and scale of cultivated land. These factors determine the vulnerability in food production systems and food security.
Size, growth, structure and density of population are key determinants to GHG emissions and other environmental impacts of cities [16]. Hanson et al. [17] reports that “on the global-scale, population growth, socio-economic growth and urbanization are the most important drivers of the overall increase in exposure particularly in developing countries, as low-lying areas are urbanized. The increasing frequency and intensity of extreme climatic events and slow onset changes will increase the vulnerability of urban economic assets. Most basic services such as water supply, sanitation, energy provision, and transportation system are vulnerable for human settlement, industry and infrastructure. Apart from the detrimental impacts of extreme events such as flooding and droughts, the agricultural production is affected by climate change which is linking drop in production to poverty levels at the regional level, national economic welfare and the global food commodity prices in the sector of human health, security, livelihood and poverty [18].
Reducing Vulnerability
Assessment of reducing vulnerability and impact also provide a starting point for the determination of effective remedial action to diminish impacts and to re-establish the original conditions as soon as possible by supporting spontaneous or planned responses as policies. The Driver-Pressure-State-Impact-Response (DPSIR) framework provides a conceptual connection between ecosystem change and the driving forces of such change, together with the effects of pressure of ecosystem and impact on livelihood. It also serves to highlight the dynamic characteristics of ecosystem and socioeconomic systems changes, involving multiple feedbacks with a co-evolutionary process of change (Figure 2). For the most significant improvements, priority should go to policies that reduce the vulnerability.
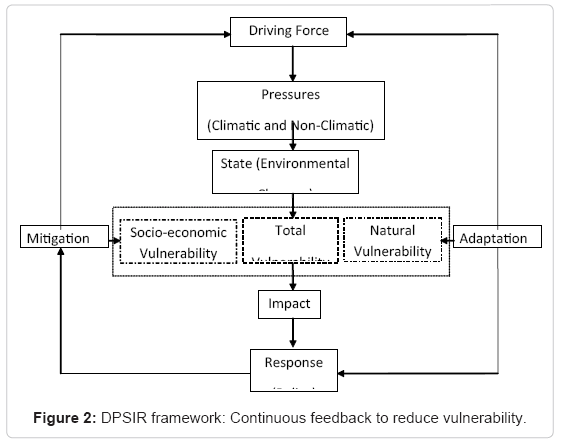
Figure 2: DPSIR framework: Continuous feedback to reduce vulnerability.
Two types of policy response are possible: reducing the threat through prevention and preparedness initiatives and improving the coping capacity of vulnerable groups to enable them to deal with the threat.
Reducing exposure to threats
Exposure to threats can be minimized by reducing the risk — in other words the probability that the damage will occur. Better environmental management, improved policies to protect ecosystems and environmental restoration can be effective and practical ways to reduce vulnerability. In the long term, every effort to achieve sustainability in natural resource use, to reduce waste generation and pollution and to bring society back into balance with the local environment and global systems should reduce human vulnerability.
Reinforcing coping capacity
Improving the coping capacity helps to reduce the damage caused by extreme events or environmental degradation. The ability to cope with threats includes the ability to absorb impacts by guarding against or adapting to them. Adaptation is vital where the impacts to people are vulnerable appear inevitable.
Conclusions
Research on vulnerability is ideally a multidisciplinary endeavor involving physical and social scientists with diverse specializations. Vulnerability to climate change is recognized as a state generated not just by climate change but by multiple processes and stressors. Vulnerability describes a central concept in climate change research as well as in the research communities dealing with natural hazards and disaster management, ecology, public health, poverty and development, secure livelihoods, famine, sustainability science, and land change. This study presented the two indexes LVI and LEI to identify and analyze vulnerability to climate change impacts.
Vulnerability is defined by a combination of social and environmental factors that could change over shorter or longer time spans. Changes in the social causes of vulnerability often happen much more rapidly than many environmental changes. Impacts from climate change severely threaten the developmental efforts and opportunities across developing countries. The DPSIR framework is useful for structuring the analysis of the linkages between cause effect relationship of vulnerability to climate change as a pressure on environment and the resulting consequences for ecosystem services and policy responses. This framework is significantly important in selecting all appropriate indicators of vulnerability index to determine the climate change impact on ecosystem and livelihood and also contributing the role in reducing of vulnerability. The response factor integrated with the adaptation and mitigation will help to cope with the challenges posed by climate change.
References
- Polsky C, Neff R, Yarnal B (2007) Building comparable global change vulnerability assessments: the vulnerability scoping diagram. Glob Environ Change17: 472-485.
- McCarthy JJ, Canziani OF, Leary NA, Dokken DJ, White KS (2001) IPCC, 2001: Climate Change 2001: Impacts, Adaptation and Vulnerability. In: Cambridge: Cambridge University Press, Cambridge, UK, and New York, USA.
- Smith K (1992) Environmental Hazards: Assessing Risk and Reducing Disaster. (2ndedn), Routledge Physical Environment Series, Routledge, London.
- Fussel HM (2007) Vulnerability: A generally applicable concept framework for climate change research. Glob Environ Change 17: 155-167.
- IPCC 2007, Cimate Change 2007: the physical science basis. Summary for policy makers Contribution of working group I to the Fourth Assessment Report of the Intergovernmental Panel on Climate Change.
- Hahn MB, Riederer AM, Foster SO (2009) The Livelihood Vulnerability Index: A pragmatic approach to assessing risks from climate variability and change—a case study in Mozambique. Glob Environ Change19: 74-88
- Downing TE, Butterfield R, Cohen S, Huq S, Moss R, et al. (2001) Climate Change Vulnerability: Linking Impacts and Adaptation. UNEP, Nairobi.
- Adger WN (1999) Social vulnerability to climate change and extremes in coastal Vietnam. World Development27: 249-269.
- EEA 1999, Environmental indicators: Typology and overview. Technical report No 25.
- United States Geological Survey (USGS) (2011) Archived from the original document on 2011-04-05.
- Liu H, Feng CL, Luo YB, Chen BS, Wang ZS, et al. (2010) Potential Challenges of Climate Change to Orchid Conservation in a Wild Orchid Hotspot in Southwestern China. Botanical Review 76: 174-192.
- La Sorte FA, Jetz W (2011) Projected range contractions of montane biodiversity under global warming. Proc Biol Sci 277: 3401-3410.
- Noroozi J, Pauli H, Grabherr G, Breckle SW (2011) The subnival-nival vascular plant species of Iran: a unique high-mountain flora and its threat from climate warming. Biodiversity and Conservation 20: 1319-1338.
- Peh KSH, Soh MCK, Sodhi NS, Laurance WF, Ong DJ, et al. (2011) Up in the Clouds: Is Sustainable Use of Tropical Montane Cloud Forests Possible in Malaysia? Bioscience 61: 27-38.
- Forbes DL, Rachold V, Kremer H, Lantuit H (2011) State of the Arctic Coast 2010: Scientific Review and Outlook. International Arctic Science Committee, Land-Ocean Interactions in the Coastal Zone, ArcticMonitoring and Assessment Programme, and International Permafrost Association, Geesthacht, Germany, 178pp.
- UN-HABITAT, 2011: Cities and climate change: Global report on human settlements 2011. Earthscan, London, Washington DC.
- Hanson S, Nicholls R, Ranger N, Hallegatte S, Corfee-Morlot J, et al. (2011) A global ranking of port cities with high exposure to climate extremes. Climatic Change 104: 89-111.
- Hertel TW, Burke MB, Lobell DB (2010) The poverty implications of climate-induced crop yield changes by 2030. Glob Environ Change 20: 577-585.
Citation: Khajuria A, Ravindranath NH (2012) Climate Change Vulnerability Assessment: Approaches DPSIR Framework and Vulnerability Index. J Earth Sci Climat Change 3: 109. DOI: 10.4172/2157-7617.1000109
Copyright: ©2012 Khajuria A, et al. This is an open-access article distributed under the terms of the Creative Commons Attribution License, which permits unrestricted use, distribution, and reproduction in any medium, provided the original author and source are credited.
Share This Article
Recommended Journals
Open Access Journals
Article Tools
Article Usage
- Total views: 21510
- [From(publication date): 6-2012 - Nov 21, 2024]
- Breakdown by view type
- HTML page views: 15754
- PDF downloads: 5756