Research Article Open Access
Variations in Mixing Ratios of Ambient Ammonia, Nitric Oxide and Nitrogen Dioxide in Different Environments of India
| S.K. Sharma1*, M. Saxena1, T.K. Mandal1, Y.N. Ahammed3, H. Pathak2, A. Datta1, T. Saud1 and B.C. Arya1 | |
| 1Radio and Atmospheric Sciences Division, National Physical Laboratory, Council of Scientific and Industrial Research (CSIR), New Delhi-110 012, India. | |
| 2Environmental Sciences Division, Indian Agricultural Research Institute, New Delhi-110 012, India. | |
| 3Department of Physics, Yogi Vemana University, Vemanapuram, Kadapa-516003, India | |
| Corresponding Author : | Sudhir Kumar Sharma Radio and Atmospheric Sciences Division National Physical Laboratory Council of Scientific and Industrial Research (CSIR) Dr. K S Krishnan Road, New Delhi-110 012, India Tel: 91-11-45609448 Fax: 91-11-45609310 E-mail: sudhir@nplindia.ernet.in, sudhircsir@gmail.com |
| Received November 27, 2010; Accepted December 27, 2010; Published December 29, 2010 | |
| Citation: Sharma SK, Saxena M, Mandal TK, Ahammed YN, Pathak H, et al. (2010) Variations in Mixing Ratios of Ambient Ammonia, Nitric Oxide and Nitrogen Dioxide in Different Environments of India. J Earth Sci Climat Change1:102. doi:10.4172/2157-7617.1000102 | |
| Copyright: © 2010 Sharma SK, et al. This is an open-access article distributed under the terms of the Creative Commons Attribution License, which permits unrestricted use, distribution, and reproduction in any medium, provided the original author and source are credited. | |
Visit for more related articles at Journal of Earth Science & Climatic Change
Abstract
Mixing ratios of ambient NH3, NO and NO2 were measured over three different environments viz Delhi, Dibrugarh and Thiruvananthapuram during 2009-10 to study their diurnal variations, concentration and source strength. The average mixing ratio of NH3 over Delhi, Dibrugarh and Thiruvananthapuram were recorded as 13.24 ± 0.39, 13.46 ± 2.52 and 12.65 ± 1.51 ppb respectively. The average mixing ratio of NO2 was recorded as 12.69 ± 0.39 with maxima of 20.22 ppb and minima of 0.75 ppb over Delhi whereas, the mixing ratio of ambient NO2 ranges from 0.65 to 3.65 ppb and 0.83 to 3.02 over Dibrugarh and Thiruvananthapuram respectively. The mixing ratio of NO and NO2 varying significantly at all the three locations except NH3 might be due to source strength and meteorological conditions of the locations. Result reveals that the mixing ratio of ambient NH3 is positively correlated with ambient temperature (r2 = 0.872) and NO2 (r2 = 0.975) over Delhi whereas non-significant at other locations.
| Keywords |
| Ambient NH3; NO; NO2; Diurnal variation; Chemiluminescence method |
| Introduction |
| NH3 is a reactive nitrogen has important effects on atmospheric chemistry and sensitive terrestrial or aquatic ecosystems arises from both natural and anthropogenic sources. Anthropogenic sources of atmospheric NH3 are agricultural practices, livestock establishment, roadside vehicles and industrial activities [1-4] along with natural sources like forest fire and losses from soil under native vegetation [5,6]. NH3 although not a very toxic substance, contributes to eutrophication of oligotrophic ecosystems, acid rain [7], photochemical smog, mentioned in connection of forest decline and global warming [8]. NH3 cannot be rained out from the troposphere without the atmospheric acids [9] unlike NO and NO2. It is primary neutralizing agent for atmospheric acids (H2SO4, HNO3 and HCl) and forms inorganic aerosols like (NH4)2SO4, NH4NO3 and NH4Cl [10] which affects global radiative forcing [11]. Depending on the meteorological conditions NH3 may be transported <10 to 100 km; however; NH4+ may be transported much longer distance (100 to >1000 km) under some conditions [12]. Thus contributes to international transboundary air pollutant issues addressed by UNECE Convention on Long Range Transboundary Pollution [13]. |
| One of the major problems originated by the air pollution in urban areas is the pollution caused by photochemical oxidants. Among these, O3 and NOx are capable to cause adverse impacts on human health and environment [15]. These compounds lead to several health problems like lung tissue damage, emphysema and bronchitis. Sources of atmospheric NOx vary from rural areas to cities. The oxides of nitrogen (NOx) are emitted from several sources viz. thermal power plants, transport, biomass burning, industries to the atmosphere as NO, which is simultaneously converted into NO2 and other nitrogenous species leading to formation of several photo oxidants (viz. O3, N2O5, PAN) [15]. |
| NH3 is also a motor vehicle exhaust species and is an unregulated byproduct of three way catalytic converters over reducing NO when reducing agent are present [16]. Hydrogen produced in the water-gas shift reaction (CO + H2O → CO2 + H2) could be a major contributor to NH3 formation through overall reaction of 2NO + 2CO + 3H2 → 2NH3 + 2CO2 or 2NO + 5H2 → 2NH3 + 2H2O [17]. However, atmospheric NH3 can get oxidized to NO (NH3 + O2→ NO + H2O; G0 = -57.34 Kcal mole-1.) and can oxidized with NO2 to N2O (NH3 + NO2 → N2O + H2O) which is a potent greenhouse gas. |
| In the present study the mixing ratio of ambient NH3, NO and NO2 alongwith meteorological parameters have been measured in campaign mode at three locations of India i.e., Delhi, Dibrugarh and Thiruvananthapuram during July 2009 and January 2010. The objective of this study was to estimate the mixing ratio of NH3, NO and NO2 at different locations, to analyze possible sources and variability. |
| Methodology |
| Description of study sites |
| The mixing ratio of ambient NH3, NO, and NO2 alongwith meteorological parameters (temperature, RH, wind speed and wind direction etc.) were measured over Delhi, Dibrugarh and Thiruvananthapuram to study their diurnal variation and source strength. The description of the study sites are: |
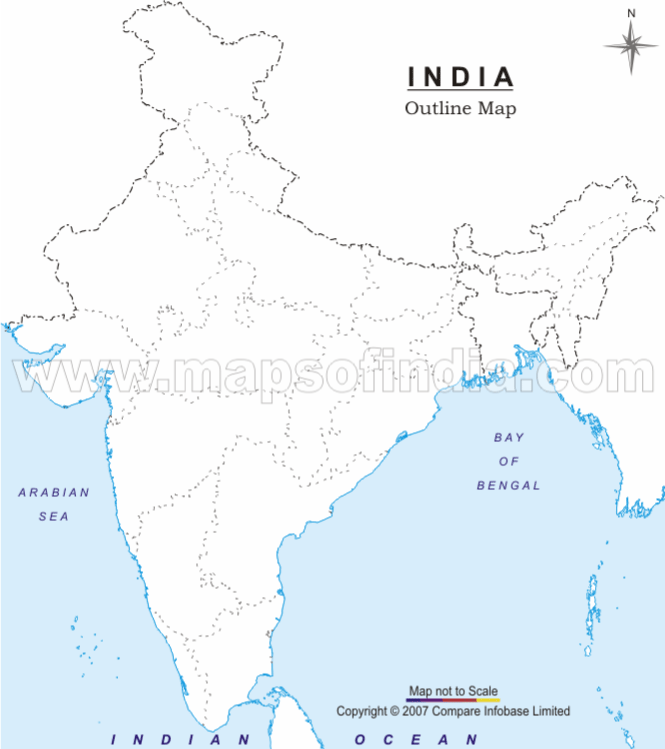
| Delhi: The study was conducted at National Physical Laboratory, New Delhi (28°38’N, 77°10’E; 220m m.s.l.), India (Figure 1) during July 2009. Delhi, the capital city of India, located in the northern part of India. It is one of the ten most polluted cities of the world and third most polluted city of the country having numerous industries in and around the city. The total number of registered vehicles in the city reached to about 6.35 million during the year 2009-10 [18]. Large agricultural fields of Indian Agricultural Research Institute (IARI) located at the NW to SW parts around 500 m away from the study site. Central ridge forest area is located in the SE direction. One industrial area is located about 6 km away in west and SW direction. NE is mainly dominated with the traffic during the rush hours (8am-11am and 4pm- 8pm) of the day. The temperature of Delhi varies from 1°C during winter (November to February) to 48°C during summer (March to June). The average rainfall in Delhi is 73cm, mostly received during the monsoon (July to October). Most of the time wind blows from WNW and NW directions over Delhi [19]. |
| Dibrugarh: The experiment was also conducted at the campus of Dibrugarh University, Dibrugarh (27.15°N; 94.43°E; 93m m.s.l.) which is situated on the banks of the Brahmaputra River, in upper Assam, India. The Dibrugarh district is well known for its vast mineral resources (including oil, natural gas and coal), flora and fauna and many tea plantations. Oil and Timber are the other big two industries in and around Dibrugarh. As per 2001 census of India, Dibrugarh had a population of 1,22,523. The climate of Dibrugarh is basically subtropical monsoon due to its unique physiographical elements. The average annual rainfall of the Dibrugarh city is 276 cm with the total number of 193 rainy day. The average annual temperature of Dibrugarh is 23.9°C with minimum 8-10 °C and maximum 33-37 °C. The climate of the Dibrugarh is most suitable for cultivation of a variety of grain and horticultural crops. |
| Thiruvananthapuram: The study was also conducted at National Institute of Interdisciplinary Science and Technology (NIIST), Thiruvananthapuram (8.55°N; 76.77°E; 3m m.s.l.) during January 2010. It is a capital city of Kerala along the west coast of India. Being a tropical, coastal location, it is situated close to the geographical equator and seasonal changes are not as perceptible at Thiruvananthapuram as at the temperate latitude. During December to March, the prevailing atmospheric circulation in the lower troposphere is primarily from the inland continental region directed towards the ocean, constituting a continental air mass type. This flow is generally dry because these winds arrive from the dry continental interiors and will be richer in continental pollutants and originated from significantly anthropogenic. The minimum temperature are, in general, ranges from 18 to 22°C and the diurnal variation (difference between maximum and minimum temperature) in temperature exceeds 15°C on an average, and go as high as 17°C at time. The RH generally remains between 40% and 60% signifying the prevalence of a dry environment despite of coastal proximity. The prevailing winds are generally weak (<~6ms-1) northerly signifying an airmass directed from the interior continental India, which is drier [20]. The sky is mostly clear and cloud free and rainfall is scantly. |
| Experimental set up |
| Ambient NH3, NO, NO2 alongwith meteorological parameters (temperature, RH, wind speed and wind direction etc) were measured during July, 2009 and January 2010 over Delhi, Dibrugarh and Thiruvananthapuram. |
| NH3 mixing ratio was measured using NH3-Analyzer (Model: CLD88CYp, M/s. ECO Physics AG, Switzerland) operating based on chemiluminescence method. In this analyzer two catalytic converters of different characteristics allow sequential detection of NOx and NOx- amines by converting them into NO. NH3 mixing ratio was calculated from the difference between NOx and NOx-amine (NH3 = NOx-amine - NOx) with an accuracy of ± 50 ppt. mixing ratio of NO and NO2 were measured using NOx-Analyzer (Model: CLD88p, M/s. ECO Physics AG. Switzerland) with Photo-catalytic Converter (Model: PLC860 M/s. ECO Physics AG. Switzerland) operating based on chemiluminescence method with an accuracy of ± 50 ppt. It was calibrated before and after solar eclipse events using zero air generator and NIST certified NO span gas (500 ppb ± 5%) |
| In addition, the meteorological parameters such as temperature (accuracy ± 1°C), relative humidity (accuracy ± 2%), wind speed (accuracy ± 2% of full scale) and wind direction (accuracy ± 2°) were recorded using calibrated Portable Weather Logger (M/s. RainWise Inc., Bar Harbor, Maine). Summary of the meteorological parameters during study period is presented in Table 1. |
| Sampling inlets of all analyzers and Portable weather logger were stationed at 6-8 m height (above the ground) and at same location. These analyzers were operated continuously for the period of 1-8, July 2010 at Delhi, 20-25, July 2010 at Dibrugarh and 12-18, January 2010 at Thiruvananthapuram. The mixing ratio of NH3, NO, NO2 and meteorological parameters were recorded at 1 minute time resolution during the study period at all the locations. Statistical analysis of all the data sets was done using standard recommended methods. |
| Results and Discussion |
| The mixing ratio of ambient NH3, NO and NO2 alongwith meteorological parameters i.e., temperature, RH, wind speed and wind directions etc., were measured and analyzed over Delhi, Dibrugarh and Thiruvananthapuram to estimate mixing ratio and source apportionment of these trace gases. The average mixing ratio of NH3, NO and NO2 along with maximum and minimum values are summarized in Table 2 of these locations. |
| Mixing ratio of ambient NH3 |
| Average mixing ratio of ambient NH3 over Delhi was recorded as 13.24 ± 0.39 ppb (monsoon) with a range of 3.23 and 23.52 ppb, whereas average mixing ratio of NH3 were recorded as 13.46 ± 2.32 ppb and 12.65 ± 1.51 ppb over Dibrugarh and Thiruvananthapuram respectively (Table 2). Sharma et al. [3] reported the average mixing ratio of ambient NH3 as 20.23 ± 2.71 ppb and 17.47 ± 1.85 ppb during winter and autumn [4] respectively, over Delhi. The median value of NH3 at Cochin (9.58°N, 76.73°E, msl~01 meter), which is closest point to Thiruvananthapuram [21] is of the order of 19 ppb matches with present reported value. The measurement of NH3 mixing ratio has been carried out first time at Dibrugarh and Thiruvananthapuram based on chemiluminescence method. |
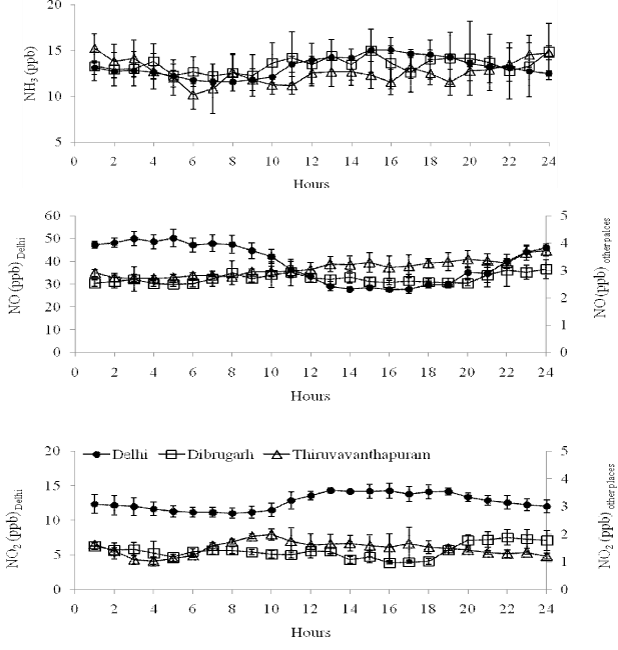
| Figure 2 shows the average diurnal variation of ambient NH3 over Delhi, Dibrugarh and Thiruvananthapuram. The maximum ambient NH3 mixing ratio during day time recorded between 11:00 to 16:00h over Delhi whereas 10:00 to 15:00h and 12:00 to 15:00h over Dibrugarh and Thiruvananthapuram (Figure 2). Average day and night time mixing ratio of ambient NH3 was recorded as 13.55 ± 0.31 ppb and 12.92 ± 0.39 ppb respectively over Delhi whereas; average day and night time mixing ratio of ambient NH3 was recorded as 13.48 ± 2.11 ppb and 13.43 ± 2.45 ppb over Dibrugarh and 12.11 ± 1.46 ppb and 13.20 ± 1.56 ppb over Thiruvananthapuram. However, there is no significant difference in day and night value of ambient NH3 during the study (P > 0.05) over these locations. Results suggest that the night time average mixing ratio of ambient NH3 over Thiruvananthapuram is marginally higher than the day time. The study reveals that the atmospheric NH3 mixing ratio is significantly correlated with ambient temperature (r2 = 0.86) as reported by Parmar et al. [22]. Day time increase in ambient temperature attributes to increase in soil temperature which leads to increase soil ammonification and release of NH3 from soil [4]. However, apart from the increase in ambient temperature, increase of vehicular density during day time may also contribute to increase in the ambient mixing ratio of NH3. Similar results were also reported by Whitehead et al. [23] over urban area of Manchester, a city of NW England. |
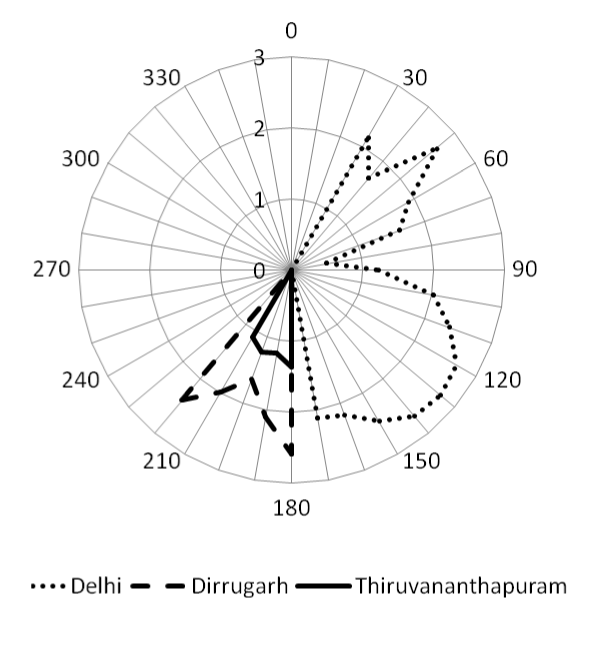
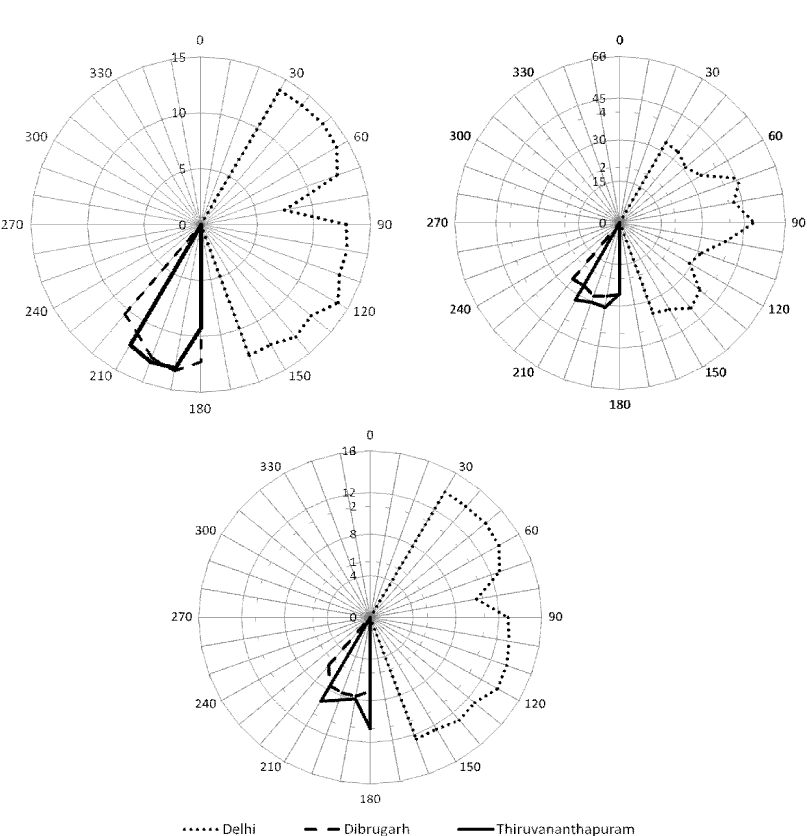
| The average mixing ratio of atmospheric NH3 during the study period was recorded (34.56%) lower than the winter season in Delhi (20.23 ± 9.42 ppb) at the same observational site [3]. The measurement of NH3 has been carried out during monsoon season may also be one of the reason for reduction of NH3 mixing ratio at Delhi. The maximum wind speed (Figure 3) 2.5 ms-1 along with NE and SE directions were observed during study period indicates the influence (wind rose plot of NH3; Figure 4) of NH3 from road vehicles, industries and livestock around these area. However, the large agricultural fields are also situated around 500 m in the NW direction of the study area. |
| The surrounded observation area of Dibrugarh mostly covered with tea gardens, agricultural practices and oil industries. The influence of vehicular emission around the study area compared with Delhi is very less. The average wind speed (Figure 3) in SSW is recorded 1.2 ms-1 indicates the local emission of NH3 might be due to tea plantation and other agricultural practices (Figure 4). Similarly, the study site at Thiruvananthapuram surrounded low and marginal agricultural activities. The wind rose plot of NH3 (Figure 4) also indicates (SE irection) indicates agricultural activities may be the source of NH3 at the study site. |
| Mixing ratio of ambient NO |
| The average NO mixing ratio recorded as 39.29 ± 2.52 ppb with a range of 2.05–71.61 ppb at Delhi during monsoon (Table 2). An increase in the NO mixing ratio is observed during morning (between 08:00 and 16:00) and thereafter decreases to minimum upto mid night (Figure 3). The average mixing ratio of NO was recorded as 2.70 ± 0.39 ppb and 3.09 ± 0.21 ppb at Dibrugarh and Thiruvanathapuram respectively (Table 2). The diurnal variation of NO mixing ratio followed more or less similar trend like at Delhi. NO mixing ratio over Delhi is recorded one order higher than the other locations may be due to influence of heavy traffic, industries, thermal power plants and rapid urban activities. |
| Early morning increase in the NO mixing ratio may be attributed to photochemical breakdown of more stable nitrogen compound PAN or increase in the traffic in the nearby area and photolysis of HNO2 [24] or combination of both. However, photochemical breakdown of peroxyacetyl nitrate also contributes to the higher NO in the early morning. Wind rose plot of the NO mixing ratio suggests the higher mixing ratio from the NE, E and SE direction of the observation site (Figure 4), wind directions NO mixing ratio is also recorded in the same direction (at Delhi). Higher NO mixing ratio in these directions indicates the major source of NO is road traffic, which is about 100 to 200 m away from the observational site. However, it is also attributed to photochemical breakdown of more stable nitrogen compound PAN or combination of both (traffic and breakdown of PAN). Mixing ratio of NO recorded at Dibrugarh and Thiruvananthapuram are very less compared to Delhi might be due to less influence road traffic. |
| Mixing ratio of ambient NO2 |
| Ambient NO2 mixing ratio ranges from 0.75 to 20.22 ppb with the average value of 12.69 ± 0.39 ppb over Delhi. Whereas average NO2 mixing ratio were recorded as 1.41 ± 0.08 ppb 1.49 ± 0.10 ppb over Dibrugarh and Thiruvananthapuram respectively (Table 2). NO2 mixing ratio over Delhi recorded one order higher than the other locations might be due to anthropogenic activities (emission from heavy traffic, thermal power plants, industries etc) at Megacity. There is an increase in trend of NO2 mixing ratio is observed during morning time at all the locations (Figure 3) might be due to balance between photochemical destruction of NO2 and chemical reaction of NO with O3 or due to fresh vehicular emission around the study sites. Just after sunrise, peroxyacetyl nitrate (PAN) breaks into NO in sunlight. Because of short lifetime, NO rapidly converts to NO2 in interaction with O3 or O2. However, due to photochemical reaction, NO2 breaks into NO and O1D, which produces O3 in the presence of sunlight. After sometime, NO, NO2 and O3 attain steady state condition. The wind rose and wind directions of NO2 mixing ratio indicate the same source as NO at Delhi, Dibrugarh and Thiruvananthapuram respectively. |
| Conclusions |
| Mixing ratios of ambient NH3, NO and NO2 were measured at three different environment of India (Delhi, Dibrugarh and Thiruvananthapuram). The average mixing ratio of NH3 over Delhi, Dibrugarh and Thiruvananthapuram were recorded as 13.24 ± 0.39, 13.46 ± 2.52 and 12.65 ± 1.51 ppb respectively during the study. The average mixing ratio of NO2 is recorded as 12.69 ± 0.39 with maxima of 20.22 ppb and minima of 0.75 ppb over Delhi whereas, the mixing ratio of ambient NO2 ranges from 0.65 to 3.65 ppb and 0.83 to 3.02 over Dibrugarh and Thiruvananthapuram respectively. Non-significant diurnal variations in mixing ratio of ambient NH3, NO, and NO2 were observed during the study period at all locations. The mixing ratio of NO and NO2 varying significantly at all the three locations except NH3 may be due to source strength and meteorological conditions of the locations. |
| Acknowledgements |
| Authors are thankful to Prof. R.C. Budhani, Director and Dr. S.K. Sarkar, Head, RASD, National Physical Laboratory, New Delhi, India for their constant encouragement and support. Authors thankfully acknowledge the Department of Science and Technology, Government of India, New Delhi (Grant No: SR/S4/ AS: 12/2008) and Indian Space Research Organization, Department of Space, Bangalore (under CAWSES-India program) for financial support. |
References
|
Tables and Figures at a glance
| Table 1 | Table 2 | Table 3 |
Figures at a glance
 |
 |
 |
 |
| Figure 1 | Figure 2 | Figure 3 | Figure 4 |
Relevant Topics
- Atmosphere
- Atmospheric Chemistry
- Atmospheric inversions
- Biosphere
- Chemical Oceanography
- Climate Modeling
- Crystallography
- Disaster Science
- Earth Science
- Ecology
- Environmental Degradation
- Gemology
- Geochemistry
- Geochronology
- Geomicrobiology
- Geomorphology
- Geosciences
- Geostatistics
- Glaciology
- Microplastic Pollution
- Mineralogy
- Soil Erosion and Land Degradation
Recommended Journals
Article Tools
Article Usage
- Total views: 15427
- [From(publication date):
December-2010 - Jan 16, 2026] - Breakdown by view type
- HTML page views : 10679
- PDF downloads : 4748
