Research Article Open Access
Quantitative HPLC Analysis of Ascorbic Acid and Gallic Acid in Phyllanthus Emblica
Laxman Sawant*, Bala Prabhakar and Nancy PanditaSchool of Pharmacy & Technology Management, SVKM’s NMIMS, Vile Parle (W), Mumbai, India
- *Corresponding Author:
- Laxman P. Sawant
School of Pharmacy & Technology Management
SVKM’s NMIMS, Vile Parle (W), Mumbai, India
Tel: +919869686164
E-mail: laxmanpsawant@gmail.com
Received date: October 16, 2010; Accepted date: November 30, 2010; Published date: December 02, 2010
Citation: Sawant L, Prabhakar B, Pandita N (2010) Quantitative HPLC Analysis of Ascorbic Acid and Gallic Acid in Phyllanthus Emblica. J Anal Bioanal Tech 1:111. doi: 10.4172/2155-9872.1000111
Copyright: © 2010 Sawant L, et al. This is an open-access article distributed under the terms of the Creative Commons Attribution License, which permits unrestricted use, distribution, and reproduction in any medium, provided the original author and source are credited.
Visit for more related articles at Journal of Analytical & Bioanalytical Techniques
Abstract
A reversed-phase high-performance liquid chromatographic method has been developed and validated for simultaneous estimation of ascorbic and gallic acid in Phyllanthus emblica L. (Euphorbiaceae). A C18 column was used with a gradient elution of methanol and 0.1% (v/v) acetic acid in HPLC-grade water as mobile phase at a flow rate of 0.9 mL min -1 . UV detection was performed at 278 nm. The method was validated for accuracy, precision, linearity, specificity and sensitivity in accordance with International Conference on Harmonisation guidelines. Amounts of ascorbic and gallic acid detected in freeze-dried extract of the plant were 4.58% and 0.59%. Total run time was 50 min. ascorbic and gallic acid was eluted with retention times of 3.60 and 10.77 min respectively. Validation revealed that the method is specific, accurate, precise, reliable and reproducible. Calibration plots were linear over the concentration ranges 30–90 μg mL -1 for ascorbic acid and 5–15 μg mL -1 for gallic acid, respectively. Limits of detection were 1.42 and 1.56 μg mL -1 and limits of quantification were 4.32 and 4.73 μg mL -1 for ascorbic and gallic acid, respectively. Recovery was 99.37 % and 98.68% for ascorbic and gallic acid, respectively and the coefficient of variance was <2.0% for both. In negative ESI mode, the spectra showed the signals at m/z of 174.98 for ascorbic acid and m/z of 168.98 for gallic acid .The high percentage recovery and low coefficient of variation confirm the suitability of the method for simultaneous analysis of ascorbic and gallic acid in Phyllanthus emblica .
Keywords
RP-HPLC; LC-MS/MS; Validation; Ascorbic acid; Gallic acid
Introduction
Emblica (Phyllanthus emblica L.), an euphorbiaceous plant, is widely distributed in subtropical and tropical areas of India, China , Indonesia and Malay Peninsula and used in many traditional medicinal systems, such as Chinese herbal medicine, Tibetan medicine and Ayurvedic medicine [1]. It is a rich dietary source of vitamin C, minerals and amino acids and also contains a wide variety of phenolic compounds, such as tannins, phyllembelic acid, phyllemblin, rutin, curcuminoides and emblicol [2]. Earlier studies have demonstrated potent antimicrobial, antioxidant, anti-inflammatory, analgesic and antipyretic, adaptogenic, hepatoprotective, antitumor, antiulcerogenic and antidiarrheal activities in the fruits of Phyllanthus emblica [3-7]. Phyllanthus emblicafruits possess antimutagenic and anticarcinogenic properties owing to the combined presence of β-carotene, ascorbic acid and chlorophylin and have also been shown to modulate several biochemical events associated with tumor promotion such as alteration of protein kinase C (PKC) activity [8]. The fruits of Phyllanthus emblica are reported to contain hydrolysable tannins, emblicanin A and emblicanin B, along with pedunculagin and punigluconin [9].
There are various difference found in the composition of ascorbic acid in the fruits of Phyllanthus emblica may be due to different geographical location. Bhat et al studied the plant extract in the south coast of India. According to Bhat et al. the ascorbic acid was present below the quantifiable limits of HPLC-DAD (LOD ) 1 ppm and LOQ ) 3 ppm), also earlier Ghosal et al. questioned its presence in fruits in the north India [10]. Scartezzini studied plant extract in Italy, where he found ascorbic acid in large percentage. Scartezzini et al. proposed a reliable HPLC-DAD for the identification and quantification of ascorbic acid and further indicated that high antioxidant activity is due to a large percentage of the presence of ascorbic acid [11].
Keeping in view of their biological importance, a sensitive method for rapid estimation and separation of these markers has become a necessity for development and standardization of herbal drugs. HPLC is the method of choice for analysis of phenolic compounds, because of its extremely high versatility, precision and relatively low cost [12-14]. Reversed phase (RP) HPLC on a C18 column, with a binary mobile phase containing acidified water and a polar organic solvent (acetonitrile or methanol) with UV–visible diode-array detection (DAD), is usually preferred and is a crucial and reliable tool for routine analysis of plant phenolic compounds [15]. LC–MS is the most reliable method for identification and characterization of compounds. Efficient resolution is regarded as the prerequisite for a method developed for separation of multiple phenolic groups [16].
All those earlier reported methods describe analysis of ascorbic acid and gallic acid individually, but unfortunately there is no method which could determine both analytes simultaneously. So there is need to develop, validate and apply the method in real sample analysis.
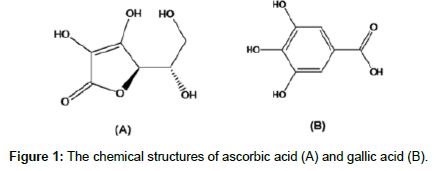
In the present study we have developed and validated a sensitive and selective HPLC method for the simultaneous quantification of ascorbic acid and gallic acid in fruits of Phyllanthus emblica. The structures of ascorbic acid and gallic acid are shown in Figure 1.
Experimental
Plant collection, identification and documentation
The fresh fruits of Phyllanthus emblica L. were collected from Junnar, Dist. Pune, India and was authenticated at Agharkar Research Institute Pune, India, with a voucher specimen (F-140) which were deposited in the herbarium.
Chemicals and materials
Ascorbic acid, gallic acid were procured from Sigma-Aldrich (Bangalore, India), HPLC grade methanol, acetonitrile and water were purchased from J.T. Baker (NJ, USA). Glacial acetic acid was purchased from Merck (Mumbai, India).
Standard preparation
Ascorbic and galllic acid (10 mg each) were weighed accurately and transferred to separate 100 mL volumetric flasks. Both standards were dissolved in 100 mL methanol to prepare standard stock solution of 100µg mL-1.
Sample preparation
The fresh fruits of Phyllanthus emblica L. cut in to small pieces and seeds were removed. The fruit pieces were crushed to obtained juice. The juice was passed through a 60-mesh sieve and filtered juice was freeze-dried (Freezone 4.5, Labconco, USA) under high vacuum (133 × 104 mBar) at -40 ± 2°C to get dry powder. The accurately weighed freeze-dried (0.2 g) were transferred in 50 ml volumetric flask contains 30 ml extraction solvent (methanol–water (70:30, v/v) and sonicated for 20 min at 27±3°C in ultra sonicator water bath and diluted up to mark. The solution was filtered through a 0.45-µm membrane prior to injection into the HPLC and LC-MS/MS system.
Analytical method
HPLC–UV method: Separation for qualitative and quantitative analysis of the ascorbic acid and gallic acid were performed by HPLC– UV with a an Agilent 1100 Series HPLC system (Agilent,Waldbronn, Germany) with diode array detector (operated at 278 nm) and injection valve with 20-µL sample loop. Compounds were separated on a 4.6 mm × 250 mm, i.d., 5-µm pore size Zorbax SB RP-C18 column protected by a guard column containing the same packing. The mobile phase was a gradient prepared from 0.1% (v/v) acetic acid in HPLC-grade water (component A) and methanol (component B). Before use the components were filtered through 0.45-µm. A gradient was used as 0-15 min, 5% B; 15-40 min, 80% B; 40-42 min, 5% B; and 42-50 min, 5% B. The flow rate was 0.9 mL min-1. Data were integrated by Shimadzu class VP series software and results were obtained by comparison with standards. Results are mean values from three replicate analyses of the same sample. Samples and solutions were filtered through 0.45-µm Nylon filters (Millipore) before analysis by HPLC or mass spectrometry. Simple mobile phase was used as control for identification of blank peaks.
LC-MS/MS method: Mass spectrometry was performed with an Acquity UPLC and Xevo Quards mass spectrometer. A electro ion spray source was used in negative ion mode with the settings: Capillary voltage: 3.5V, Cone voltage: 35V, Dissolveation temp: 600°C, Nebuliser gas flow: 1000L/hr, MS2 Scan from 100 to 900amu. Product-ion scans of selected molecules were conducted to confirm compound structure.
Construction of calibration plots: Solutions of both standards having different concentrations were prepared by dilution of the standard solutions. These solutions (20µL) were chromatographed and the peak areas were measured. Peak areas were then plotted against the respective concentrations for both ascorbic acid and gallic acid. From the plots it was found that the linear range for ascorbic acid was between 30 and 90 µg mL-1 whereas that for gallic acid was between 5 and 15 µg mL-1.
Method validation
The method was validated for linearity, accuracy, precision, repeatability, selectivity and specificity. Accuracy was assessed by measuring recovery at three different levels, 80, 100 and 120% of the amount expected from analysis of the sample, in accordance with ICH guidelines. Precision assessed by measurement of intra and inter-day precision. In the intra-day study the concentrations of both drugs were calculated three times on the same day at intervals of 1 h. In the inter-day study the concentrations of the drugs were calculated on three different days. Selectivity and specificity of the method were assessed by injecting solutions containing both the standards; after chromatography two sharp peaks were obtained for both standards. LOD and LOQ were measured to evaluate the detection and quantitation limits of the method. They were calculated by use of the equations LOD = 3.3 σ/S and LOQ = 10 σ/S, where σ is the standard deviation of the response and S is the slope of the calibration plot.
Results and Discussion
HPLC separation optimization
Column chemistry, solvent type, solvent strength (volume fraction of organic solvent(s) in the mobile phase and pH of the buffer solution), detection wavelength and flow rate were varied to determine the chromatographic conditions giving the best separation. The mobile phase conditions were optimized so there was no interference from solvent and other compounds.
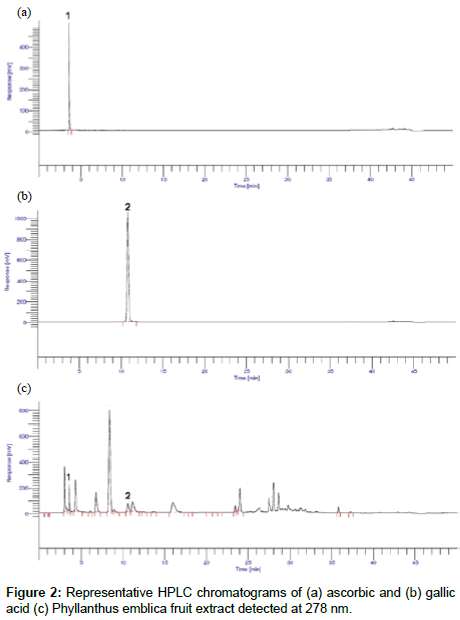
For HPLC analysis, initially various mobile phases were tried in attempts to obtain the best separation and resolution between ascorbic and gallic acid. The mobile phase consisting of gradient elution of methanol and 0.1% (v/v) acetic acid in HPLC-grade water was found to be an appropriate mobile phase allowing adequate separation of ascorbic and gallic acid using Zorbax SB C18 reversedphase column at a flow rate of 0.9 ml/min. Under this system, the chromatogram of ascorbic acid, gallic acid and Phyllanthus emblica extract is shown in Figure 2. The retention times for ascorbic and gallic acid were 3.60 and 10.77 min, respectively.
Validation of the method
The method was validated for linearity, accuracy, precision, selectivity and specificity. All validation studies were performed by replicate injection of sample and standard solutions.
Linearity
The linearity was determined separately for ascorbic and gallic acid. Solutions of the standards at seven different concentrations were analyzed and calibration curves were constructed by plotting mean areas against the respective concentrations. The method was evaluated by determination of the correlation coefficient and intercept values (Table 1). From the calibration plots it was clear that the linear range for ascorbic acid was between 5 and 40µg mL-1 whereas that for gallic acid was between 5 and 50µg mL-1.
| Compound | Retention time (min) | Regression equation | Correlation coefficient (R) | Linear range (μg mL−1) |
Detection limit (μg mL−1) |
|---|---|---|---|---|---|
| Ascorbic acid | 3.60 | y = 10151x + 1978 | 0.9998 | 30- 90 | 1.42 |
| Gallic acid | 10.77 | y = 68180x + 7550.6 | 0.9997 | 35- 15 | 1.56 |
Table 1: Validation data from calibration curves of ascorbic and gallic acid in Phyllanthus emblica fruit extract.
Accuracy
The accuracy of the method was confirmed by conducting a recovery study at three different concentrations (80, 100 and 120% of the amount expected from analysis of the formulation) by replicate analysis (n = 7), in accordance with ICH guidelines. Standard solutions were added to a preanalysed sample solution and recovery of the drug was calculated. Results from the accuracy study are reported (Table 2).
| Compound | Intra-day R.S.D. for retention time (%) | Intra-day R.S.D. for peak area (%) |
Inter-day R.S.D. for retention time (%) |
Inter-day R.S.D. for peak area (%) |
|---|---|---|---|---|
| Ascorbic acid | 1.14 | 1.04 | 1.27 | 1.48 |
| Gallic acid | 1.62 | 1.34 | 1.68 | 1.15 |
Table 2: Precision (n=7).
From the recovery study it is clear that the method enables very accurate quantitative analysis of ascorbic and gallic acid in phyllanthus emblica, because all the statistical results were within the acceptable range, i.e. RSD < 2.0% and S.D. < 1.0.
Precision
The intra-day and inter-day precisions (expressed as the relative standard deviation (R.S.D.) for retention time and peak area were determined for ascorbic and gallic acid standards by repeated analysis (n = 7) (see Table 3).
| Compound | Amount added (µg mL−1) | Amount found | Recovery (%) | Average Recovery % |
| Ascorbic acid | 48 | 47.96 | 99.92 | 99.37 |
| 60 | 59.23 | 98.73 | ||
| 72 | 71.62 | 99.48 | ||
| Gallic acid | 8 | 7.94 | 99.27 | 98.68 |
| 10 | 9.87 | 98.77 | ||
| 12 | 11.76 | 98.01 |
Table 3: Recoveries of ascorbic and gallic acid in the Phyllanthus emblica (n=7).
The results obtained from (Table 3) show that intra-day and interday relative standard deviations for retention time and for peak area are both quite low and the precision is good.
Selectivity and specificity
The selectivity of the method for the standards was established by study of the resolution between the standards peaks. Under the proposed chromatographic conditions ascorbic acid and gallic acid were completely separated from each other This indicates the method is selective for simultaneous estimation. Specificity was assessed by comparing the chromatograms obtained from extract and from the standards shown in Figure 2. Because the retention times of both standard solutions and Phyllanthus emblica fruit extract were identical and no co-eluting peaks from the diluents were observed, the method was specific for quantitative estimation of both drugs in the commercial formulation.
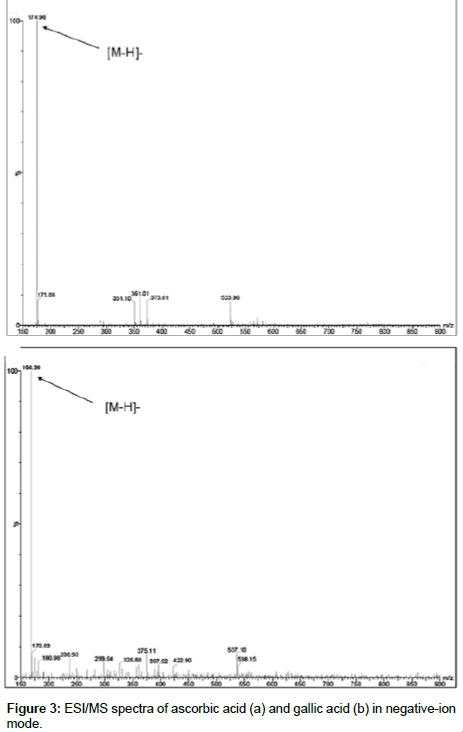
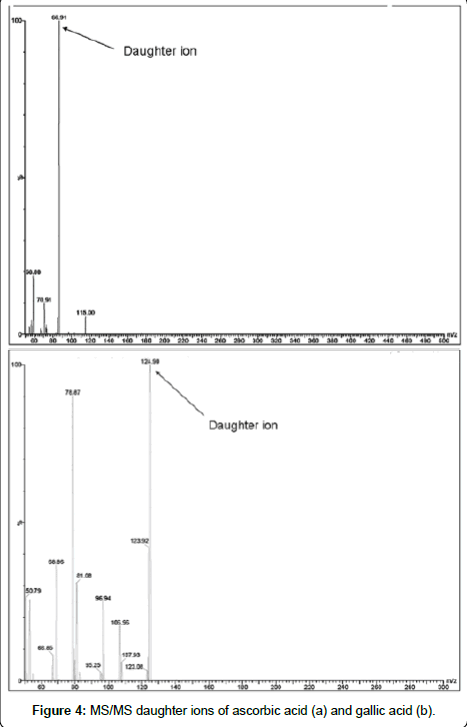
Additionally, an LC-MS experiment was performed to confirm the identity of the peaks of interest Figure 3. The HPLC conditions were slightly changed as the separation had to be performed at room temperature and a flow rate of 0.9 ml /min did not allow a sensitive detection of the compounds. With modifications in the solvent composition and flow rate, the MS signals were readily assignable. In negative ESI mode, the spectra showed the signals at m/z of 174.98 for ascorbic acid and m/z of 168.98 for gallic acid in Figure 3. Further fragmentation showed the daughter ions 86.91 and 124.90 respectively for ascorbic and gallic acid as shown in Figure 4.
Conclusions
The HPLC method mentioned here represented an excellent technique for simultaneous determination of ascorbic and gallic acid in the extract of Phyllanthus emblica, with good sensitivity, precision and reproducibility. The method gives a good resolution among ascorbic and gallic acid with a gradient elution (50 min). The method was also successfully applied to Phyllanthus emblica extracts and phenolic compounds were identified in the extract for the first time. It is possible to applied LC-MS/MS for identification and quantification. These compounds can be used as chemical markers for quality control and standardization of the single and multiple compound herbal formulations containing Phyllanthus emblica.
Acknowledgement
The authors are grateful to NMPB, Department of AYUSH, New Delhi for giving grant for research work, Dr Amit Agarwal for revving this article and to Dr. R. S. Gaud, Dean, SPTM, SVKM’s NMIMS for providing necessary facilities to carry out the research work.
References
- Zhang YJ, Tanaka T, Iwamoto Y, Yang CR, Kouno I (2000) Phyllaemblic acid, a novel highly oxygenated norbisabolane from the roots of Phyllanthus emblica. Tetrahedron Lett 41: 1781-1784.
- Kim HJ, Yokozawa T, Kim HY, Tohda C, Rao TP, et al. (2000) Influence of amla (Emblica officinalis Gaertn.) on hypercholesterolemia and lipid peroxidation in cholesterol-fed rats. J Nutr Sci Vitaminol 51: 413-418.
- Ahmad J, Mehmood Z, Mohammad F (1998) Screening of some Indian medicinal plants for their antimicrobial properties. J Ethnopharmacol 62: 183- 193.
- Perianayagam JB, Sharma SK, Joseph A, Christiana AJ (2004) Evaluation of antipyretic and analgesic activity of Emblica officinalis Gaertn. J Ethnopharmacol 95: 83-85.
- Rege NN, Thatte UM, Dahanukar SA (1999) Adaptogenic properties of six rasayana herbs used in Ayurvedic medicine. Phytother Res 13: 275-291.
- Jeena KJ, Joy KL, Kuttan R (1999) Effect of Emblica officinalis, Phyllanthus amarus and Picrorhizia kurroa on N-Nitrosodiethyl amine induced hepatocarcinogenesis. Cancer Lett 136: 11-16.
- Jose JK, Kuttan Y, Kutan R (2001) Antitumour activity of Emblica officinalis. J Ethnopharmacol 75: 65-69.
- Jeena KJ, Kuttan G, George J, Kuttan R (1996) Antimutagenic and anticarcinogenic activity of Emblica officinalis Gaertn. J Clin Biochem Nutr 22: 171-176.
- Ghosal S, Tripathi V K, Chauhan S (1996) Active constituent of Emblica officinalis: part 1-the chemistry and antioxidant effects of two new hydrolysable tannins emblicanin A and B. Indian J Chem 35: 941-948.
- Bhat B, Majeed M, Jadhav AN, Srivastava JS, Nagabhushanam K (2009) Ascorbic Acid and Tannins from Emblica officinalis Gaertn. Fruits-A Revisit. J Agric Food Chem 57: 220-225.
- Scartezzini P, Antognoni F, Raggi MA, Poli F, Sabbioni C (2006) Vitamin C content and antioxidant activity of the fruit and of the Ayurvedic preparation of Emblica officinalis Gaertn. J Ethnopharmacol 104: 113-118.
- Tsao R, Yang RJ (2003) Optimization of a new mobile phase to know the complex and real polyphenolic composition: towards a total phenolic index using high-performance liquid chromatography. J Chromatogr A 1018: 29-40.
- Escarpa A, González MC (2000) Optimization strategy and validation of one chromatographic method as approach to determine the phenolic compounds from different sources. J Chromatogr A 897: 161-170.
- Escarpa A, González MC (2001) Approach to the content of total extractable phenolic compounds from different food samples by comparison of chromatographic and spectrophotometric methods. Anal Chim Acta 427: 119- 127.
- Revilla E, Ryan JM (2000) Analysis of several phenolic compounds with potential antioxidant properties in grape extracts and wines by high-performance liquid chromatography-photodiode array detection without sample preparation. J Chromatogr A 881: 461-469.
- Singh DP, Govindarajan R, Rawat AKS (2008) High-performance liquid chromatography as a tool for the chemical standardisation of Triphala an Ayurvedic formulation, Phytochem. Anal 19: 164-168.
Relevant Topics
Recommended Journals
Article Tools
Article Usage
- Total views: 33089
- [From(publication date):
December-2010 - Feb 06, 2026] - Breakdown by view type
- HTML page views : 25726
- PDF downloads : 7363


