Groundwater Quality and its Suitability for Irrigation and Domestic Purposes: A Study in Rajnagar Block, Birbhum District, West Bengal, India
Received: 26-Jan-2016 / Accepted Date: 23-Feb-2016 / Published Date: 27-Feb-2016 DOI: 10.4172/2157-7617.1000337
Abstract
Groundwater is indispensible for continuity of life and sustainability of ecosystem. It is needed in almost every sphere of human activity. Hence, this study is aimed at assessing the ground water quality in Rajnagar block, Birbhum district, West Bengal, India, with respect to drinking and irrigation uses. A total of 17 groundwater samples each for both post- and pre-monsoon periods have been collected. The physical parameters pH, Electrical Conductivity (EC), Total Dissolved Solids (TDS) have been determined in the field itself. The samples were analysed for cations like Ca, Mg, Na, K and anions like Cl, HCO3 and SO4. Overall, the groundwater in the study area is found to be slightly acidic to basic (pH ranging from 6.32 and 7.26 in pre-monsoon and 6.3 to 7.33 in post-monsoon) and moderately hard to very hard (Total Hardness ranging from 109.39 mg/L and 2328.43 mg/L in premonsoon and 60.6 mg/L and 969.79 mg/L in post-monsoon) in nature. Concentration of sulphate is above the maximum permissible limit in seven of the post-monsoon samples. Piper’s diagram indicates groundwater is mostly of bicarbonate type. Groundwater of the study area is moderately suitable for drinking. Water Quality Indices (WQI) indicates 75% of pre-monsoon samples are excellent to good for drinking purposes whereas the value reduces to 56% during postmonsoon. The calculated values of Sodium Adsorption Ratio (SAR), Residual Sodium Carbonate (RSC) and Soluble Sodium Percentage (SSP) indicate well to permissible range of water for use in irrigation. Magnesium Adsorption Ratio (MAR) and RSC values at some sites limit use for agricultural purposes. Ground water chemistry is controlled by rockwater interaction as expressed by Gibb’s diagram.
Keywords: Quality of groundwater; Piper’s diagram; Water quality index; Gibb’s diagram; Irrigation and drinking suitability
Introduction
Water is the manna of life. Clean water is the best form of medicine available to mankind, animals and plants. At the dawn of civilization, settlements were built along river banks. Population size was less. Surface water was the main resource. Gradually, exponential rise in population size led to pollution and depletion of river water. People took recourse in groundwater believing that it is safe in all respects. From quenching thirst, washing, cleaning, use for agriculture to operation of high-power industries, groundwater plays a very vital role. This indispensable resource is a victim of over-exploitation, pollution and exhaustion. Rate of groundwater development and management is not at par with rate of utilization. Presently India is the biggest user of groundwater for agriculture in the world [1]. The stage of groundwater development is about 61%. The development has not been uniform in different areas of the country [2]. The treatment of groundwater as a general property and various socio-economic conditions make the groundwater resource management problem more complex.
Aquifer waters suffer from pervasive contamination. Unlike rivers, the damage is generally irreversible. Rate of groundwater renewal is very slow in comparison with that of surface water. Since water in aquifers moves through Earth at snail’s pace, the pollutants continue to accumulate. So the amount of clean water available is diminishing. The hydrochemistry of groundwater depends on source of groundwater itself, ion-exchange process, interaction with aquifer material [3] and reaction of the water with the rocks and sediments through which they flow [4-9]. There are various physico-chemical parameters which play a vital role regarding the quality of groundwater for consumption and irrigation purposes. If the concentration of any parameter is above the prescribed limit [10,11] there can be serious health issues. Several workers have assessed the groundwater quality and its suitability for drinking and irrigation purposes [12-20]. The groundwater quality and its suitability in the Oshnavieh area, Iran has been assessed [21] based on physical and chemical parameters. The hydrochemistry and groundwater suitability for irrigation and drinking purposes in different parts of the world have also been evaluated [22-26]. Detailed hydrochemical analysis of water samples from the coastal tract of south Orissa has been carried out to assess the quality of groundwater in the region [27]. Ground water quality zonation was done in Nalgonda district using GIS techniques [28]. Assessment of quality of this vital resource and monitoring of its different parameters is essential for particularly water from those sources which serve as drinking water sources [29-40]. Groundwater quality has been deteriorating over the last few decades due to massive rise in rate of industrialization and population [41,42].
The present work aims at finding the groundwater quality of Rajnagar block of Birbhum district, West Bengal and hence determining its suitability for drinking and irrigation purposes. This block has semiarid climate and people are mostly dependent on groundwater for irrigation.
The groundwater quality of the area needs to be continuously monitored to get the long-term sustainability. In view of this, an attempt has been made to analyze the groundwater quality of the study area to determine the exact level of physico-chemical parameters giving emphasis on its irrigation and domestic suitability. Attempts have also been made to have graphical representation showing contour maps for various water quality parameters which aids policy makers in taking rapid decision on rational use and further exploitation of this resource. Since there has been no previous study on groundwater quality of this block, this study will serve as guideline at exhaustively discussing the groundwater quality of Rajnagar block in future.
Study Area
Rajnagar (community development block) is an administrative division in Suri Sadar subdivision of Birbhum district in West Bengal, India (Figure 1). It is located on the western edge of the district, bordering on Jharkhand. The latitudinal and longitudinal extents are 23.87°N to 24.05°N and 87.24°E to 87.46°E. It has an area of 221.20 km2. It has an average elevation of 101 m (331 ft). The block experiences hot and humid tropical climate. Summer begins from mid-March and continues till June with scorching heat and temperatures soaring up to 48°C. South west monsoon laden winds bring rains from June to October. Annual rainfall varies from 1100-1400 mm. Dry, bitter winters are experienced from November to February with temperatures falling to 4-5°C. It is a drought prone block.
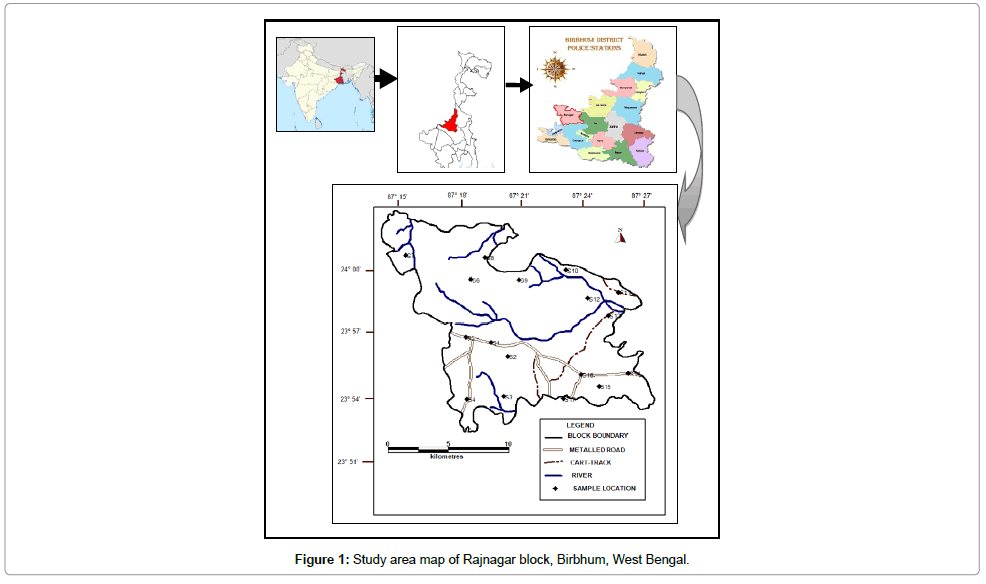
Figure 1: Study area map of Rajnagar block, Birbhum, West Bengal.
The entire block has an undulating topography. The western and south western parts are more rugged compared to the eastern part. It is marked by upland, ridges with frequently dissected riverine network. Geological formation comprises of Archaean basement made up of granite, granite-gneiss, biotite schist and calc-granulite. It is unconformably overlain by flaggy shales, clays and compact sandstones (Dubrajpur beds) of Lower Jurassic age followed by recent laterites, lateritic gravel and alluvium [43]. Major soil types are red sandy and loamy soil, lateritic soil and older and younger alluvial soil. Ferrugenous concretions known as duricrusts are present in soil.
Materials and Methods
In the present study, base map showing locations of investigating points has been prepared using SoI Topo sheets 73 M/1, 73 M/2 and 72 P/8. The GIS and image processing software TNT Mips 2012 has been used to prepare the study area maps. The maps available have been scanned and imported into TNT Mips 2012 and the locations of the sampling points have been imported through point import function.
Seventeen (17) groundwater samples each were collected from bore wells for two different periods, post-monsoon in November 2014 and pre-monsoon in May 2015 (Figure 1). Each sample was collected in acid-washed polyethylene 500 ml bottle. Before collection of water in a particular bottle, the bottle was rinsed thoroughly with the respective samples of the groundwater. Sample location was written on the bottle and suitable preservatives were added for storage till completion of quantitative chemical analysis. The bottle was filled to the brim with water taking care that no air bubble was trapped within the water sample. In order to prevent evaporation, the bottles were sealed with double plastic caps and precaution was also taken to avoid sample agitation during transfer to the laboratory. Immediately after collection, samples were transferred to the laboratory.
The pH, electrical conductivity (EC) and total dissolved solids (TDS) values in samples were recorded in the field itself using Hanna portable pH-EC-TDS meter instrument. Samples were analyzed in the laboratory for the major ionic concentrations employing standard methods [44]. Concentrations of major cations like Calcium (Ca2+), Magnesium (Mg2+), Sodium (Na+) and Potassium (K+) were determined by flame atomic absorption spectrophotometer and the concentration of major anions chloride (Cl-) and sulphate (SO42-) have been determined by ion chromatography. Bicarbonate (HCO3-) was determined by acid titration with HCl.
The concentration of various ions as obtained from chemical analysis of ground water samples were converted to milliequivalent/ litre (meq/L) and used to derive certain parameters. They are Sodium Adsorption Ratio (SAR), Soluble Sodium Percentage (SSP), Magnesium Adsorption Ratio (MAR), Residual Sodium Carbonate (RSC), Permeability Index (PI), Kelly’s ratio (KR) and Total Hardness (TH). These parameters help to evaluate the irrigational as well as domestic suitability of ground water in the study area. Moreover, these values were plotted on graphical diagrams like U.S. Salinity [45], Wilcox, Doneen and Piper diagrams to determine the suitability of ground water for agricultural and drinking purposes.
Results and Discussion
Physico-chemical parameters of groundwater
pH is the measure of acidity or basicity of an aqueous solution. Solutions with a pH less than 7 are said to be acidic and solutions with a pH greater than 7 are basic or alkaline. Pure water has a pH very close to 7. During pre-monsoon period the pH varies between 6.32 and 7.26 (Table 1) with an average of 6.77. During post monsoon period the value varies from 6.3 to 7.33 with an average of 6.83 (Table 1). Contour maps (Figure 2a and 2b) indicate that post-monsoon groundwater is more basic.
| Location No. | Location Name | pH | TDS | EC | TA | Na+ | Ca2+ | Mg2+ | K+ | HCO3¯ | Cl | SO42+ | |||||||||||
|---|---|---|---|---|---|---|---|---|---|---|---|---|---|---|---|---|---|---|---|---|---|---|---|
| Rajnagar | Post | Pre | Post | Pre | Post | Pre | Post | Pre | Post | Pre | Post | Pre | Post | Pre | Post | Pre | Post | Pre | Post | Pre | Post | Pre | |
| S1 | Gulagachi | 7.03 | 6.69 | 240 | 190 | 490 | 390 | 557 | 220 | 56 | 30 | 47.04 | 47.04 | 32.44 | 88.07 | 2.5 | 3.0 | 280.6 | 268.4 | 49.98 | 69.98 | 293.96 | 19.54 |
| S2 | Muktipur | 6.58 | 6.32 | 820 | 680 | 1640 | 1380 | 726 | 300 | 79 | 44 | 193.2 | 204.96 | 116.83 | 203.75 | 5.2 | 7.0 | 366 | 366 | 349.89 | 374.88 | 1545.04 | 94.34 |
| S3 | Abadnagar | 7.01 | 6.95 | 790 | 310 | 1570 | 640 | 387 | 250 | 109 | 26 | 137.76 | 336 | 91.31 | 70.27 | 2.6 | 10.0 | 195.2 | 305 | 269.92 | 84.97 | 585.66 | 5.19 |
| S4 | AraliRajnagar | 6.91 | 6.58 | 580 | 420 | 1150 | 840 | 484 | 420 | 93 | 46 | 136.08 | 119.28 | 75.13 | 144.62 | 3.6 | 3.0 | 244 | 512.4 | 179.94 | 139.96 | 744.08 | 23.87 |
| S5 | Aligar | 7.03 | 6.83 | 140 | 110 | 290 | 240 | 460 | 150 | 41 | 24 | 26.88 | 25.2 | 21.75 | 50.46 | 1 | 1.0 | 231.8 | 183 | 169.95 | 29.99 | 120.39 | 11.25 |
| S6 | Jaypur | 7.07 | 7.02 | 170 | 150 | 350 | 310 | 266 | 180 | 46 | 26 | 31.92 | 38.64 | 26.37 | 60.84 | 1.6 | 2.0 | 134.2 | 219.6 | 29.99 | 34.99 | 105.4 | 11.78 |
| S7 | Tilaboni | 7.25 | 6.48 | 140 | 100 | 280 | 200 | 387 | 120 | 44 | 23 | 28.56 | 20.16 | 21.34 | 37.05 | 3.1 | 1.0 | 195.2 | 146.4 | 15 | 29.99 | 75.58 | 5.68 |
| S8 | Tabadumra | 7.3 | 6.67 | 110 | 170 | 220 | 330 | 460 | 220 | 29 | 29 | 26.88 | 38.64 | 17.84 | 60.84 | 1 | 1.0 | 231.8 | 268.4 | 15 | 24.99 | 61.24 | 15.7 |
| S9 | Kanmora | 6.95 | 7.04 | 110 | 60 | 220 | 130 | 436 | 80 | 30 | 16 | 21.84 | 10.08 | 15.17 | 20.96 | 1 | 0.8 | 219.6 | 97.6 | 24.99 | 19.99 | 65.91 | 1.87 |
| S10 | Haripur | 6.65 | 6.69 | 70 | 150 | 140 | 320 | 823 | 170 | 25 | 28 | 13.44 | 38.64 | 6.48 | 69.63 | 1.1 | 1.0 | 414.8 | 207.4 | 24.99 | 44.99 | 77.2 | 9.14 |
| S11 | Ganespur | 6.77 | 6.99 | 80 | 150 | 170 | 300 | 750 | 230 | 27 | 21 | 20.16 | 47.04 | 10.7 | 60.75 | 1.3 | 4.0 | 378.2 | 280.6 | 39.99 | 19.99 | 62.69 | 3.62 |
| S12 | Sajina | 6.33 | 6.76 | 230 | 150 | 450 | 310 | 726 | 110 | 39 | 23 | 42 | 35.28 | 26.84 | 64.59 | 1.7 | 2.0 | 366 | 134.2 | 64.98 | 59.98 | 559.55 | 26.22 |
| S13 | Patharchupri | 6.63 | 6.56 | 80 | 50 | 170 | 110 | 629 | 180 | 33 | 17 | 16.8 | 10.08 | 9.56 | 21.94 | 7.1 | 1.0 | 317.2 | 219.6 | 19.99 | 15 | 665.59 | 3.7 |
| S14 | Madhaipur | 6.61 | 7.02 | 590 | 580 | 1190 | 1310 | 190 | 320 | 118 | 67 | 90.72 | 75.6 | 151.59 | 4.98 | 4.6 | 6.0 | 146.4 | 390.4 | 199.94 | 244.92 | 121.19 | 57.82 |
| S15 | Chandrapur | 6.6 | 6.63 | 340 | 1080 | 680 | 2200 | 1041 | 360 | 44 | 60 | 67.2 | 283.92 | 14.84 | 388.47 | 3 | 5.0 | 524.6 | 439.2 | 114.96 | 649.8 | 278.81 | 109.28 |
| S16 | Tantipara | 6.69 | 6.59 | 180 | 160 | 380 | 350 | 799 | 150 | 35 | 21 | 42 | 45.36 | 31.72 | 64.08 | 1.4 | 2.0 | 402.6 | 183 | 169.95 | 59.98 | 165.51 | 15.99 |
| S17 | Rajnagar | 7.17 | 7.26 | 50 | 50 | 110 | 100 | 484 | 80 | 19 | 12 | 53.76 | 13.44 | 0.55 | 18.19 | 5 | 0.8 | 244 | 97.6 | 10 | 74.98 | 58.34 | 3.78 |
| Min. | 6.33 | 6.32 | 50 | 50 | 110 | 100 | 190 | 80 | 12 | 12 | 13.44 | 10.08 | 0.55 | 4.98 | 1 | 0.8 | 134.2 | 97.6 | 10 | 15 | 58.34 | 1.87 | |
| Max. | 7.3 | 7.26 | 820 | 1080 | 1640 | 2200 | 1041 | 420 | 118 | 67 | 193.2 | 336 | 151.59 | 388.47 | 7.1 | 10 | 524.6 | 512.4 | 349.89 | 649.8 | 1545.04 | 109.28 | |
| Mean | 6.86 | 6.77 | 277.64 | 268.23 | 558.82 | 556.47 | 565 | 208.23 | 51 | 30.18 | 58.60 | 81.73 | 39.44 | 84.09 | 2.75 | 2.976 | 287.78 | 254.05 | 102.91 | 116.43 | 328.60 | 24.63 | |
| Median | 6.91 | 6.69 | 170 | 150 | 350 | 320 | 484 | 180 | 41 | 26 | 42 | 38.64 | 21.75 | 60.84 | 2.5 | 2 | 244 | 219.6 | 49.98 | 59.98 | 121.19 | 11.78 | |
| Std.Dev. | 0.27 | 0.24 | 255.13 | 276.79 | 506.52 | 570.97 | 221.26 | 97.29 | 30.18 | 15.29 | 51.50 | 98.60 | 43.00 | 91.94 | 1.81 | 2.64 | 106.71 | 118.69 | 103.08 | 166.49 | 392.37 | 32.08 | |
Table1: Chemical analysis results [Post-monsoon session (November 2014) and Pre-monsoon session(May 2015)].
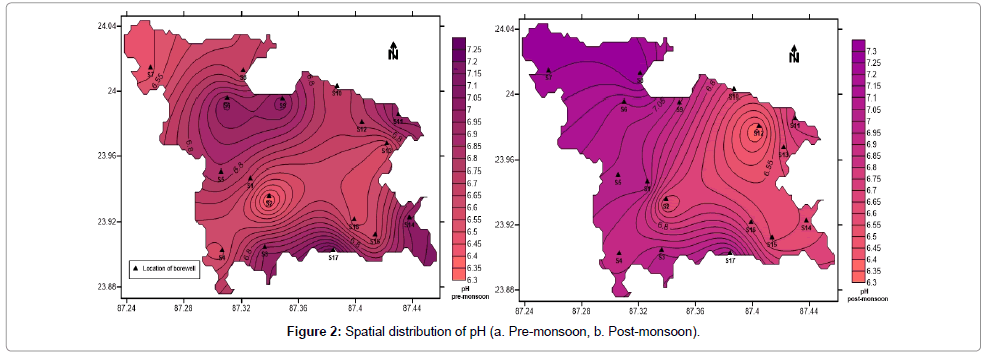
Figure 2: Spatial distribution of pH (a. Pre-monsoon, b. Post-monsoon).
Electrical Conductivity (EC) is the measure of its ability to conduct electrical current through ionic charge carriers. The ease with which the current moves through water is related to the amount of dissolved salt (Na+, Ca2+, Mg2+, K+, Cl-, SO42-, HCO3- and CO32-) predominant. During pre-monsoon period electrical conductivity varies from 100 μS/ cm to 2200 μS/cm (Table 1) with an average of 556.47 μS/cm. During post-monsoon period it varies from 110 μS/cm to 1640 μS/cm with an average of 558.82 μS/cm (Table 1). Figure 3a and 3b represent the spatial and temporal variation of EC. The values are higher during pre-monsoon period, indicating the water has higher concentration of dissolved ions.
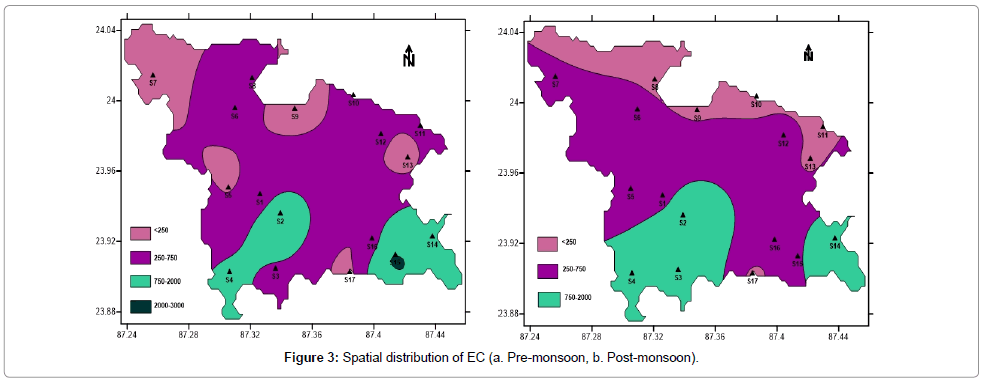
Figure 3: Spatial distribution of EC (a. Pre-monsoon, b. Post-monsoon).
Total Dissolved Solids (TDS) is the sum of all inorganic salts and small amounts of organic matter present in solution in water. The presence of excess dissolved solids in water affects its palatability. A high level of TDS is objectionable because it imparts bad taste and causes excessive scaling in water pipes, boilers and household appliances. Premonsoon values range from 50 mg/L to 1080 mg/L with an average of 268.23 mg/L, whereas post-monsoon values vary between 50 mg/L and 820 mg/L with an average of 277.64 mg/L (Table 1). Pre-monsoon values are higher. Figure 4a and 4b represents the spatial distribution of TDS. Considering the classification of water on the basis of TDS [46], the waters can be classified into fresh (TDS <1000 mg/L).
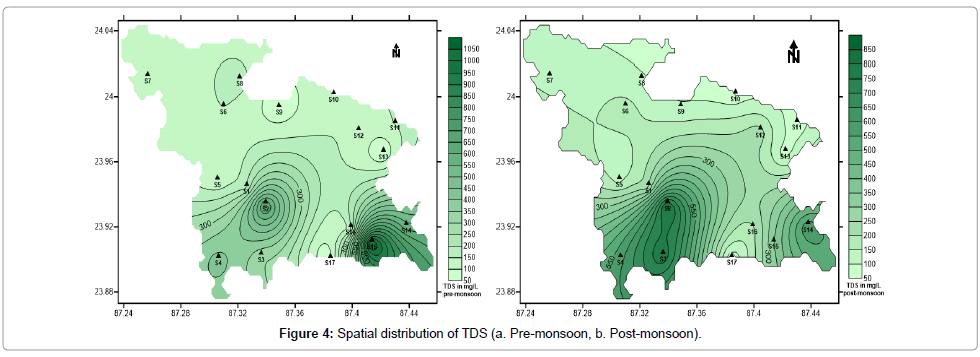
Figure 4: Spatial distribution of TDS (a. Pre-monsoon, b. Post-monsoon).
The sources of calcium and magnesium in groundwater are weathering of primary minerals such as hornblende, mica, feldspar, calcite and dolomite. In humans and animals they are essential nutrients for strength of teeth and bones. They help in strengthening of cell wall structure, metabolic processes and nutrient uptake in plants. But excess calcium and magnesium leads to hardness of water. Hard water leads to formation of scums and corrodes pipes. It interferes with the cleansing action of detergents. In general Calcium and Magnesium maintains a state of equilibrium in most groundwater [47,48]. The concentration of calcium in the water samples collected vary from 13.44 to 193.2 mg/L with an average of 58.60 mg/L (post-monsoon) and 10.08 to 336.0 mg/L with an average of 81.73 mg/L (pre-monsoon) (Table 1). Figure 5a and 5b show the spatial distribution of calcium in pre- and post-monsoon periods. The concentration of magnesium in the water samples collected vary from 0.55 to 151.59 mg/L with an average of 39.44 mg/L (post-monsoon) and 4.98 to 388.47 mg/L with an average of 84.09 mg/L (pre-monsoon) (Table 1). Figure 6a and 6b show the spatial distribution of magnesium in pre- and post-monsoon period.
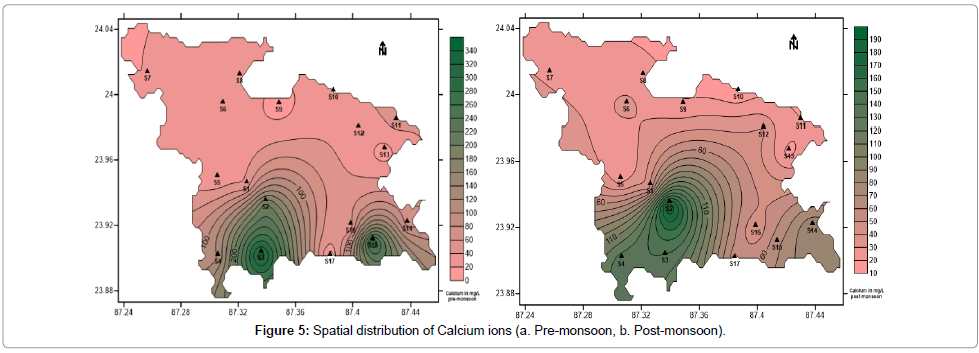
Figure 5: Spatial distribution of Calcium ions (a. Pre-monsoon, b. Post-monsoon).
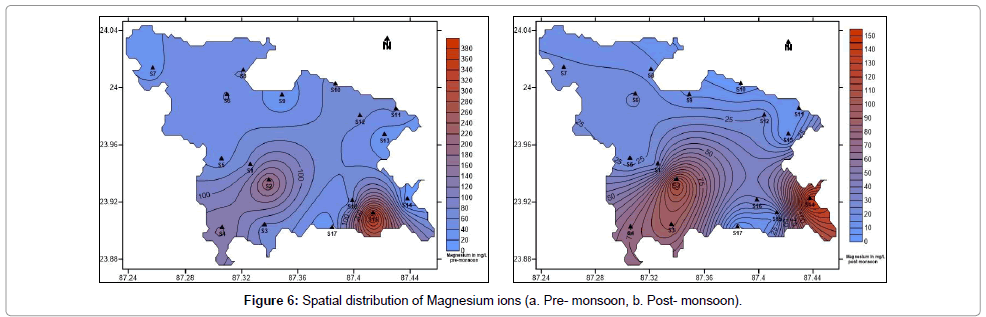
Figure 6: Spatial distribution of Magnesium ions (a. Pre- monsoon, b. Post- monsoon).
Sodium is a highly soluble chemical element which often occurs naturally in groundwater. Although it does not smell, it imparts awkward taste to the water at concentrations of 200 mg/L or more. Common sodium bearing minerals are feldspars, sodalite and evaporites. Most compounds are highly water soluble. Increased intake of sodium in drinking water is detrimental to people suffering from hypertension, heart disease or kidney problems [49]. The concentration of sodium in the water samples collected vary from 19 to 118 mg/L with an average of 51 mg/L (post-monsoon) and 12 to 67 mg/L with an average of 30.18 mg/L (pre-monsoon) (Table 1). Hence all samples are within permissible limit i.e. less than 200 mg/L. Figure 7a and 7b represent the spatial distribution of sodium during pre- and post- monsoon periods in the study area.
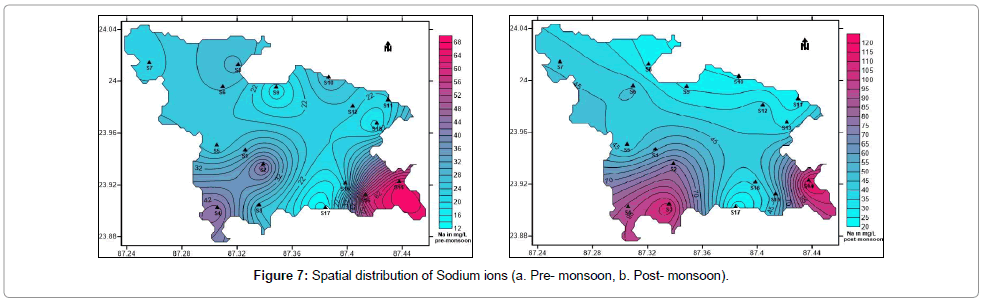
Figure 7: Spatial distribution of Sodium ions (a. Pre- monsoon, b. Post- monsoon).
Potassium controls body balance and maintains normal growth of the human body. Deficiency of potassium might lead to weakness of muscles and rise in blood pressure. The concentration of potassium in the water samples collected vary from 1.00 to 7.1 mg/L with an average of 2.75 mg/L (post-monsoon) and 0.8 to 10.0 mg/L with an average of 2.98 mg/L (pre-monsoon) (Table 1).
No standard limits have been provided by the Bureau of Indian Standards for level of sodium and potassium in drinking water.
Chloride is found naturally in groundwater through the weathering and leaching of sedimentary rocks and soils and the dissolution of salt deposits. Chloride is often attached to sodium, in the form of sodium chloride (NaCl). Sodium chloride imparts saline taste to water. Deficiency of chloride in plants leads to leaf mottling and chlorosis. Chloride toxicity symptoms in plants are: leaf margins are scorched and abscission is excessive, leaf size is reduced and may appear to be thickened and plant growth is stunted. The concentration of chloride in the water samples collected vary from 10.00 to 349.89 mg/L with an average of 102.91 mg/L (post-monsoon) and 15.0 to 649.8 mg/L with an average of 116.43 mg/L (pre-monsoon) (Table 1). Figure 8a and 8b show the spatial distribution of chloride in pre and post-monsoon period.
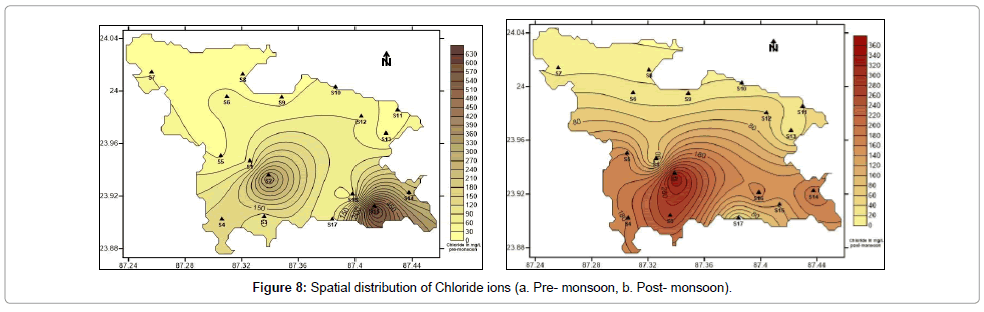
Figure 8: Spatial distribution of Chloride ions (a. Pre- monsoon, b. Post- monsoon).
The concentration of Bi-carbonate in the water samples collected vary from 134.2 to 524.6 mg/L with an average of 287.78 mg/L (postmonsoon) and 97.6 to 512.4 mg/L with an average of 254.05 mg/L (premonsoon) (Table 1)).
Sulphate ions do not have any significant detrimental effect on plants and animals. It is essential nutrient for plants. Excess sulphate concentration increases salinity and hardness of water. At levels above 1000 mg/L, sulphate in drinking water can have a laxative effect. Sulphur bacteria may produce a dark slime or deposits of metal oxides that develop as a result of the corrosion of metal pipes. Sulfate ion varied from 58.34 to 1545.04 mg/L during the post-monsoon with an average of 328.60 mg/L and from 1.87 to 109.28 mg/L in pre-monsoon seasons with an average of 24.63 mg/L. Figure 9a and 9b shows the spatial distribution of sulphate in pre- and post-monsoon period.
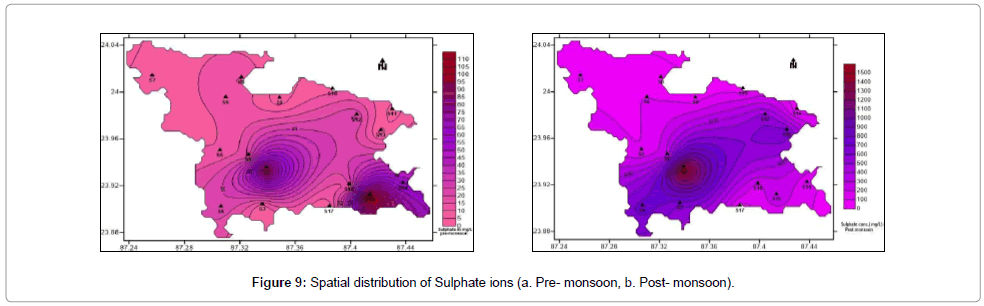
Figure 9: Spatial distribution of Sulphate ions (a. Pre- monsoon, b. Post- monsoon).
Total Alkanity value of water gives us an idea of natural salts present in water. Alkanity of water is its capacity to neutralize a strong acid and it is normally due to the presence of bicarbonates, carbonates and hydroxide compounds of calcium, sodium and potassium. According to BIS the permissible range of TA in groundwater is 200 - 600 mg/l. The total alkanity values for all the investigated samples were found to be greater in post-monsoon samples S2, S10 – S13, S15 and S16 (Total seven) exceeds the range whereas all samples in pre-monsoon fall within the prescribed range.
Correlation of physicochemical parameters of groundwater
Correlation coefficient is commonly used to establish the relationship between two variables. It is simply a measure to exhibit how well one variable predicts the other [50]. The correlation matrices for eleven (11) variables have been prepared for post-monsoon 2014) (Table 2) and pre-monsoon 2015 (Table 3). From the Table 2, it is clear that EC and TDS show good positive correlation with Na, Ca and Mg. TDS and EC also exhibit high positive correlation with Cl ions. EC and TDS also exhibit good correlation with SO4 during post-monsoon period. During pre-monsoon period (Table 3), EC and TDS show good positive correlation with Na, Mg, Cl and SO4. TDS and EC also exhibit good correlation with TA, Ca and HCO3.
| pH | TDS | EC | TA | Na | Ca | Mg | K | HCO3 | Cl | SO4 | |
|---|---|---|---|---|---|---|---|---|---|---|---|
| pH | 1 | ||||||||||
| TDS | 0.24 | 1 | |||||||||
| EC | 0.24 | 0.99 | 1 | ||||||||
| TA | 0.57 | 0.13 | 0.13 | 1 | |||||||
| Na | 0.13 | 0.90 | 0.90 | 0.49 | 1 | ||||||
| Ca | 0.18 | 0.95 | 0.95 | 0.05 | 0.44 | 1 | |||||
| Mg | 0.25 | 0.89 | 0.89 | 0.36 | 0.16 | 0.23 | 1 | ||||
| K | 0.20 | 0.33 | 0.33 | 0.06 | 0.05 | 0.003 | 0.07 | 1 | |||
| HCO3 | 0.62 | 0.10 | 0.10 | 0.99 | 0.16 | 0.08 | 0.19 | 0.03 | 1 | ||
| Cl | 0.31 | 0.89 | 0.89 | 0.01 | 0.46 | 0.56 | 0.39 | 0.22 | 0.38 | 1 | |
| SO4 | 0.42 | 0.71 | 0.70 | 0.21 | 0.26 | 0.26 | 0.20 | 0.52 | 0.20 | 0.68 | 1 |
Table 2: Correlation of physiochemical parameters of groundwater of Post-monsoon.
| pH | TDS | EC | TA | Na | Ca | Mg | K | HCO3 | Cl | SO4 | |
|---|---|---|---|---|---|---|---|---|---|---|---|
| pH | 1 | ||||||||||
| TDS | 0.30 | 1 | |||||||||
| EC | 0.28 | 0.99 | 1 | ||||||||
| TA | 0.33 | 0.78 | 0.77 | 1 | |||||||
| Na | 0.23 | 0.87 | 0.89 | 0.83 | 1 | ||||||
| Ca | 0.18 | 0.74 | 0.73 | 0.63 | 0.51 | 1 | |||||
| Mg | 0.44 | 0.85 | 0.82 | 0.62 | 0.58 | 0.24 | 1 | ||||
| K | 0.03 | 0.61 | 0.62 | 0.60 | 0.52 | 0.87 | 0.37 | 1 | |||
| HCO3 | 0.33 | 0.78 | 0.77 | 1.00 | 0.83 | 0.63 | 0.62 | 0.29 | 1 | ||
| Cl | 0.28 | 0.97 | 0.96 | 0.64 | 0.78 | 0.68 | 0.88 | 0.50 | 0.64 | 1 | |
| SO4 | 0.39 | 0.94 | 0.94 | 0.62 | 0.81 | 0.59 | 0.81 | 0.49 | 0.62 | 0.95 | 1 |
Table 3: Correlation of physiochemical parameters of groundwater of Pre-monsoon.
Irrigation water quality
The overall irrigational water quality of the samples collected, certain parameters have been derived. These include – (i) Sodium Adsorption Ratio (SAR), (ii) Soluble Sodium Percentage (SSP), (iii) Permeability Index (PI), (iv) Residual Sodium Carbonate (RSC), (v) Magnesium Adsorption Ratio (MAR) and (vi) Kelly’s Ratio (KR) [51,52]. The derived parameters have been shown in Table 4. Table 5 represents classification of samples according to standards specified for different water quality parameters.
| Location No. | Location Name | SAR | SSP | P.I | RSC | MAR | KR | TH | |||||||
|---|---|---|---|---|---|---|---|---|---|---|---|---|---|---|---|
| Post | Pre | Post | Pre | Post | Pre | Post | Pre | Post | Pre | Post | Pre | Post | Pre | ||
| S1 | Rajnagar | 1.53 | 0.59 | 33.08 | 12.47 | 61.14 | 30.94 | 4.14 | -5.29 | 53.47 | 75.73 | 0.48 | 0.13 | 252.8 | 484.6 |
| S2 | Gulagachi | 1.10 | 0.52 | 15.54 | 7.14 | 25.77 | 14.97 | -7.40 | -21.23 | 50.20 | 62.36 | 0.18 | 0.07 | 969.8 | 1361.4 |
| S3 | Muktipur | 1.76 | 0.34 | 24.90 | 5.77 | 33.94 | 14.15 | 0.33 | -17.66 | 52.49 | 25.85 | 0.33 | 0.05 | 724.9 | 1132.8 |
| S4 | Abadnagar | 1.58 | 0.67 | 24.04 | 10.34 | 35.32 | 24.47 | 0.31 | -9.62 | 47.92 | 66.90 | 0.31 | 0.11 | 653.2 | 900.8 |
| S5 | AraliRajnagar | 1.42 | 0.63 | 36.42 | 16.36 | 75.56 | 42.64 | 0.56 | -2.47 | 57.42 | 76.94 | 0.56 | 0.19 | 157.8 | 273.2 |
| S6 | Aligar | 1.45 | 0.60 | 34.98 | 14.44 | 60.12 | 37.23 | 0.53 | -3.40 | 57.93 | 72.41 | 0.53 | 0.16 | 189.7 | 350.1 |
| S7 | Jaypur | 1.51 | 0.70 | 38.32 | 20.03 | 72.31 | 50.03 | 0.60 | -1.70 | 55.46 | 75.39 | 0.60 | 0.24 | 160.3 | 204.8 |
| S8 | Tilaboni | 1.06 | 0.67 | 31.25 | 15.52 | 78.46 | 40.65 | 0.45 | -2.60 | 52.52 | 72.41 | 0.45 | 0.18 | 141.5 | 350.1 |
| S9 | Tabadumra | 1.20 | 0.66 | 36.08 | 24.14 | 87.47 | 66.54 | 0.55 | -0.65 | 53.65 | 77.61 | 0.55 | 0.31 | 117.8 | 112.5 |
| S10 | Kanmora | 1.40 | 0.62 | 47.92 | 13.85 | 160.71 | 34.20 | 0.90 | -4.33 | 44.55 | 75.02 | 0.90 | 0.16 | 60.6 | 386.7 |
| S11 | Haripur | 1.20 | 0.47 | 38.86 | 12.04 | 119.21 | 36.72 | 0.62 | -2.81 | 46.94 | 68.28 | 0.62 | 0.12 | 95.0 | 370.7 |
| S12 | Ganespur | 1.15 | 0.53 | 28.62 | 12.82 | 68.72 | 30.48 | 0.39 | -4.95 | 51.58 | 75.32 | 0.39 | 0.14 | 216.8 | 357.3 |
| S13 | Sajina | 1.59 | 0.68 | 49.69 | 24.69 | 120.96 | 85.84 | 0.88 | 1.27 | 48.68 | 78.39 | 0.88 | 0.32 | 81.8 | 116.6 |
| S14 | Patharchupri | 1.75 | 2.01 | 23.41 | 42.23 | 29.95 | 75.57 | 0.30 | 2.21 | 73.58 | 9.89 | 0.30 | 0.69 | 858.4 | 209.7 |
| S15 | Madhaipur | 1.26 | 0.54 | 30.21 | 5.55 | 74.44 | 10.76 | 0.42 | -39.37 | 26.90 | 69.52 | 0.42 | 0.06 | 229.8 | 2328.4 |
| S16 | Chandrapur | 0.99 | 0.47 | 24.72 | 11.25 | 65.30 | 31.04 | 0.32 | -4.61 | 55.73 | 70.19 | 0.32 | 0.12 | 237.2 | 380.4 |
| S17 | Tantipara | 0.71 | 0.50 | 25.87 | 19.86 | 79.39 | 65.94 | 0.30 | -0.59 | 1.68 | 69.28 | 0.30 | 0.24 | 136.7 | 109.4 |
| Min. | 0.71 | 0.34 | 15.54 | 5.55 | 25.77 | 10.76 | -7.4 | -39.37 | 1.68 | 9.89 | 0.18 | 0.05 | 60.6 | 60.6 | |
| Max. | 1.76 | 2.01 | 49.69 | 42.23 | 160.71 | 85.84 | 4.14 | 2.21 | 73.58 | 78.39 | 0.9 | 0.69 | 969.8 | 969.8 | |
| Mean | 1.33 | 0.66 | 31.99 | 15.79 | 73.46 | 40.72 | 0.25 | -6.93 | 48.86 | 65.97 | 0.48 | 0.19 | 310.83 | 310.83 | |
| Median | 1.4 | 0.6 | 31.25 | 13.85 | 72.31 | 36.72 | 0.45 | -3.4 | 52.49 | 72.41 | 0.45 | 0.16 | 189.7 | 189.7 | |
| Std. Dvn. | 0.28 | 0.36 | 8.89 | 8.85 | 35.20 | 21.71 | 2.17 | 10.38 | 15.14 | 18.81 | 0.20 | 0.15 | 292.15 | 292.15 | |
Table 4: Values of calculated water quality parameters/indices.
| Parameters | Range | Class | No. of samples | Percentage of samples | ||
|---|---|---|---|---|---|---|
| Post-monsoon | Pre-monsoon | Post-monsoon | Pre-monsoon | |||
| SAR (Richards 1954) |
<20 | Excellent | 17 | 17 | 100.00 | 100.00 |
| 20-40 | Good | 0 | 0 | 0 | 0 | |
| 40-60 | Permissible | 0 | 0 | 0 | 0 | |
| 60-80 | Doubtful | 0 | 0 | 0 | 0 | |
| >80 | Unsafe | 0 | 0 | 0 | 0 | |
| EC WHO (2008) |
<250 | Excellent | 6 | 5 | 35.29 | 29.41 |
| 250-750 | Good | 7 | 8 | 41.18 | 47.06 | |
| 750-2000 | Permissible | 4 | 4 | 23.53 | 23.53 | |
| 2000–3000 | Doubtful | 0 | 0 | 0 | 0 | |
| >3000 | Unsuitable | 0 | 0 | 0 | 0 | |
| TH (Sawyer and McCarty, 1967) |
<75 | Soft | 0 | 1 | 0 | 5.88 |
| 75-150 | Moderate | 3 | 5 | 17.65 | 29.41 | |
| 150-300 | Hard | 3 | 7 | 17.65 | 41.18 | |
| >300 | Very Hard | 11 | 4 | 64.71 | 23.53 | |
| RSC (Raghunath 1987) |
<1.25 | Safe | 15 | 16 | 88.24 | 94.12 |
| 1.25-2.50 | Marginally suitable | 2 | 0 | 11.76 | 00 | |
| >2.50 | Unsuitable | 0 | 1 | 0 | 5.88 | |
| MAR (Raghunath 1987) |
<50 | Suitable | 2 | 7 | 11.76 | 41.18 |
| >50 | Unsuitable | 15 | 10 | 88.24 | 58.8 | |
| SSP (Todd 1980) |
<200 | Suitable | 17 | 17 | 100.0 | 100.0 |
| >200 | Unsuitable | 0 | 0 | 0 | 0 | |
| KR (Kelly 1963) |
<1.0 | Suitable | 17 | 17 | 100.0 | 100.0 |
| >1.0 | Unsuitable | 0 | 0 | 0 | 0 | |
| PI (Doneen 1964) |
<80 | Good | 16 | 13 | 94.12 | 76.47 |
| 80-100 | Moderate | 1 | 1 | 5.88 | 5.88 | |
| 100-120 | Poor | 0 | 3 | 0 | 17.65 | |
| WQI (Horton 1965) |
0-25 | Excellent | 2 | 3 | 11.76 | 17.65 |
| 26-50 | Good | 11 | 7 | 64.71 | 41.18 | |
| 51-75 | Poor | 4 | 6 | 23.53 | 32.29 | |
| 76-100 | Very Poor | 0 | 1 | 0 | 5.88 | |
| > 100 | Unfit for Drinking | 0 | 0 | 0 | 0 | |
Table 5: Classification of Samples according to standards specified for different water quality parameters.
Sodium adsorption ratio (SAR): The sodium adsorption ratio (SAR) was calculated using the following equation:
SAR = (Na+)/ {[(Ca2+) + (Mg2+)]/2}1/2 (1)[53]
Concentrations of all ions have been expressed in meq/L.
High sodium concentration leads to development of alkaline soil. Alkaline soils are difficult to take into agricultural production. Due to the low infiltration capacity, rain water stagnates on the soil easily and, in dry periods, cultivation is hardly possible without copious irrigated water and good drainage. Sodium Adsorption Ratio (SAR) values are plotted against Electrical Conductivity (EC) values along Y-axis and X-axis respectively in U.S. Salinity diagram to classify water samples. In the present study the SAR values range from 0.7066 – 1.7602 in post monsoon with an average value of 1.33 and 0.3359 – 2.0114 during pre-monsoon with an average value of 0.66. Based on the SAR values all samples have low sodium hazard and on plotting over the U.S. Salinity diagram (Figure 10a and Figure 10b), the water samples fall in the C1-S1, C2-S1 and C3-S1 classes (post monsoon) and C1-S1, C2-S1, C3-S1 and C4-S1 classes (pre monsoon), and hence can be considered moderately suitable for irrigation.
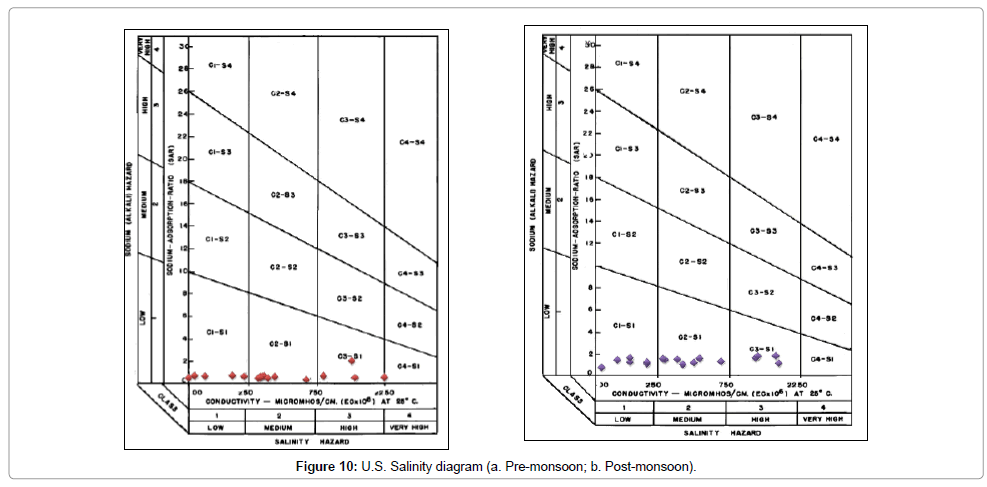
Figure 10: U.S. Salinity diagram (a. Pre-monsoon; b. Post-monsoon).
Soluble sodium percentage (SSP): It is calculated by the following equation [54]:
SSP= [(Na+ + K+)*100] / [Ca2+ + Mg2+ + Na+ + K+] (2)
All concentrations are in meq/L.
When concentration of sodium ion is high in irrigated water, it tends to be absorbed by clay particles, dispersing magnesium and calcium ions. This exchange process of sodium in water for Ca2+and Mg2+ in soil reduces the permeability and eventually results in soil with poor internal draining. The SSP values range from 15.5366 – 49.688 in post monsoon with an average value of 31.99 and 5.5503 – 42.2295 during pre-monsoon with an average value of 15.79. Wilcox [55] diagram (Figure 11) is used for classification of irrigation waters. X-axis represented by electrical conductivity and Y-axis represented by soluble sodium percentage. In pre-monsoon samples most are in “excellent to good category”, two are in “good to permissible” category and one in “doubtful” category. In post-monsoon period most of the samples are in “excellent to good” and “good to permissible” category.
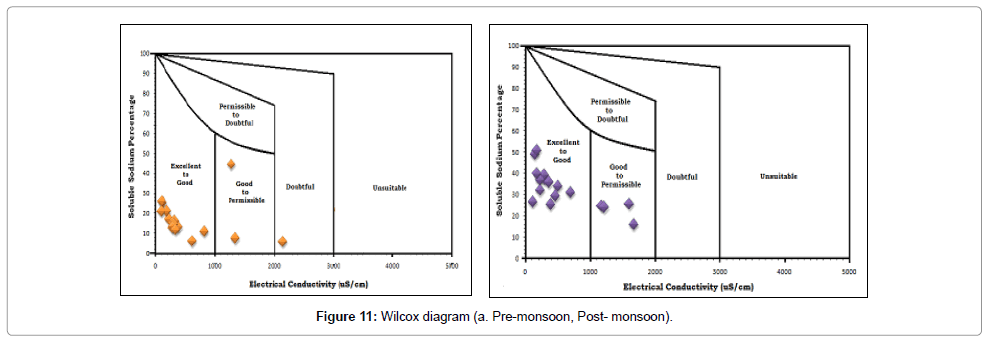
Figure 11: Wilcox diagram (a. Pre-monsoon, Post- monsoon).
Permeability index (PI): The permeability of soil is affected by sodium, calcium, magnesium and bicarbonate contents of irrigation water. Doneen [56] calculated the permeability index based on the formula
PI= {[Na + (HCO3)1/2)]*100}/ (Ca+ Mg+ Na) (3)
All concentrations are in meq/L.
PI varies from 10.761 to 85.8385 with an average value of 73.46 in pre-monsoon period and from 25.7736 to 160.7093 in post-monsoon period with an average value of 40.72. Doneen’s chart for pre and post monsoon sessions have been presented in Figure 12a and 12b respectively. During post-monsoon, 9(nine) samples are in Class I category (>75% permeability), 5(five) samples are in Class II category (25%-75%) permeability and 3(three) samples are in Class III category (<25%) permeability. During pre-monsoon, 15(fifteen) samples are in Class I category (>75% permeability) and 2(two) samples are in Class II category (25%-75%) permeability.
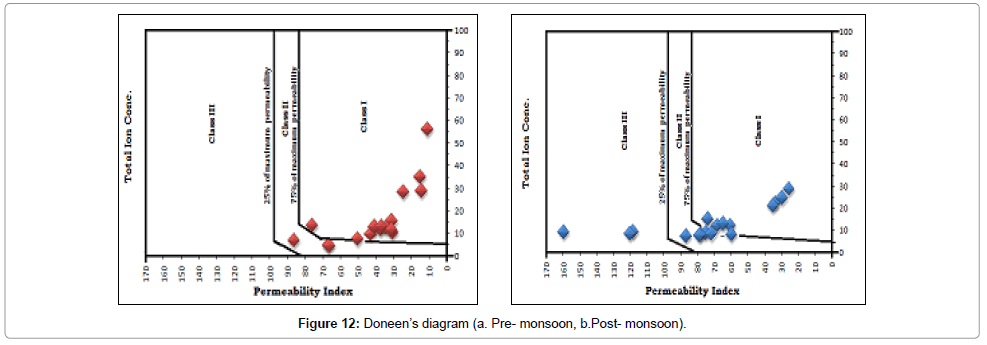
Figure 12: Doneen’s diagram (a. Pre- monsoon, b.Post- monsoon).
Residual sodium carbonate (RSC): The Residual Sodium carbonate (RSC) is calculated according to [57]:
RSC = (CO3 + HCO3) – (Ca + Mg) (4)
All concentrations are in meq/L.
When the sum of carbonates and bi-carbonates is in excess of calcium and magnesium, there may be a possibility of complete precipitation of calcium carbonate and magnesium carbonate. The concentration of Ca and Mg decreases relative to sodium and the SAR index will be bigger. This will cause an alkalizing effect and increase the pH.
RSC values less than 1.25 are considered safe for irrigation. During pre-monsoon period 88% samples have RSC values less than 1.25 and are considered to be safe. Rest 12% samples are marginally suitable with RSC values between 1.25 to 2.5. During post-monsoon period, only 29% samples are safe for irrigation with RSC values less than 1.25. Remaining 71% samples have RSC values greater than 2.5, hence unsuitable for irrigation. Post-monsoon water samples pose alkaline hazard to soil. Figure 13 shows the spatial distribution of Residual Sodium Carbonate (RSC) in pre- and post-monsoon period.
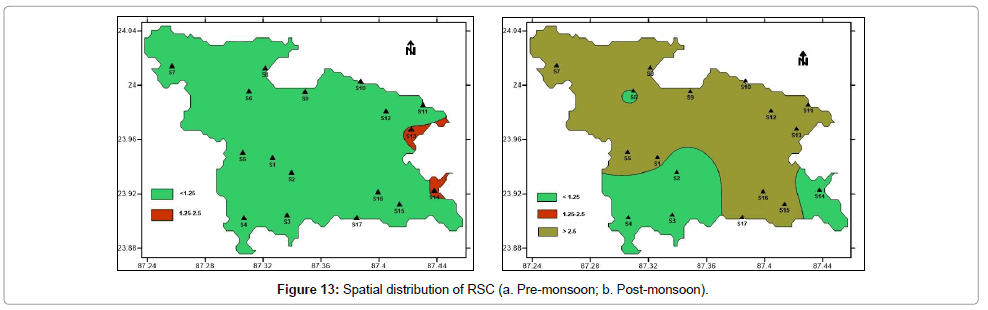
Figure 13: Spatial distribution of RSC (a. Pre-monsoon; b. Post-monsoon).
Magnesium adsorption ratio (MAR): Magnesium is essential for plant growth, but excess magnesium can have severe toxicity effect on plants. Excess magnesium in soil reduces the availability of potassium. Leaves develop coppery colour along the marginal veins in the initial stage. Extensive coppery colour develops all over the leaf surface and defoliation of leaf occurs during the final stage of toxicity
Magnesium Adsorption Ratio (MAR) is used for calculating the magnesium hazard caused when it is in equilibrium in groundwater. Magnesium Adsorption Ratio (MAR) is calculated by the equation [57] as:
MAR = (Mg*100)/ (Ca + Mg) (5)
All concentrations are in meq/L.
MAR is broadly classified into 2 groups. Less than 50 values of groundwater are considered to be suitable for irrigation whereas greater than 50 values are unsuitable. During pre-monsoon period (Figure 14a), the minimum and maximum values are 9.8927 and 78.3907 respectively with an average value of 48.86. During pre-monsoon period, only 12% samples are suitable for irrigation. 88% samples have MAR values greater than 50. During post-monsoon period (Figure 14b), the minimum and maximum values are 1.6765 and 73.5795 respectively. During post-monsoon period, only 41% samples are suitable for irrigation. 59% samples have MAR values greater than 50. Overall the MAR values are quite high for both seasons.
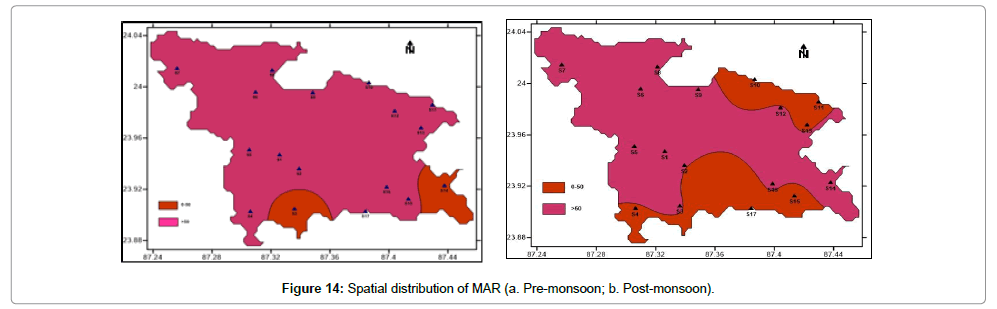
Figure 14: Spatial distribution of MAR (a. Pre-monsoon; b. Post-monsoon).
Kelly’s ratio (KR): Kelly [58] devised an equation for the sodium problem in water.
KR= Na/ (Ca + Mg) (6)
Water having KR value less than 1 is considered suitable for irrigation. All the 17 pre-monsoon as well as post-monsoon samples have KR values less than 1; hence the water is fit for irrigation.
Drinking water suitability
In many parts of our country, the groundwater, be it from dug wells or bore wells, form the major source of drinking water. In our present study, we determined standards of groundwater from Total Hardness (TH), plotting in the Piper’s diagram and also from Water Quality Index (WQI).
Total hardness (TH): Hardness of groundwater primarily results due to excessive concentration of divalent cations like calcium and magnesium in water. These ions enter a water supply by leaching from minerals within an aquifer. High levels of hard-water ions such as Ca2+ and Mg2+ can cause scaly deposits in plumbing, appliances, and boilers. These two ions also combine chemically with soap molecules, resulting in decreased cleansing action. Pre-monsoon values vary between 109.39 mg/L and 2328.43 mg/L with an average of 310.83 (Table 2). Post-monsoon values vary between 60.6 mg/L and 969.79 mg/L with an average of 310.83 mg/L (Table 2). Pre-monsoon period water is much harder compared to post-monsoon period as evident from Figure 15 which depicts the spatial distribution of hardness during both the periods.
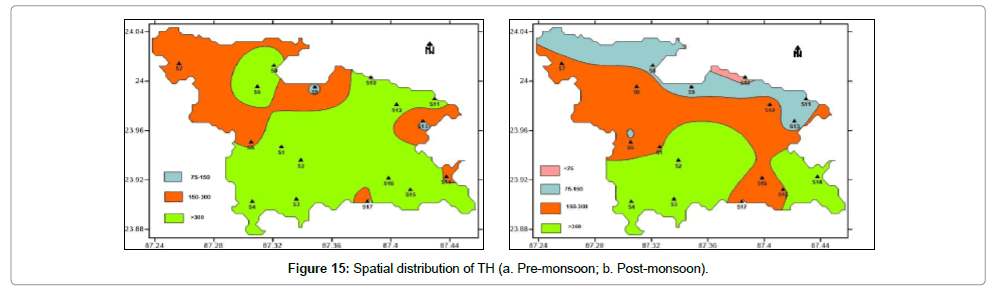
Figure 15: Spatial distribution of TH (a. Pre-monsoon; b. Post-monsoon).
Piper’s diagram: The suitability of water for drinking purpose is determined from Piper’s [59] Trilinear Diagram. It is the graphical representation of chemistry of water samples. The cations and anions are represented by separate ternary plots. The two ternary plots are then extrapolated onto the diamond diagram. Piper diagram can predict the water type in three ways – bicarbonate type, sulphate type and chloride type. The bicarbonate type is considered suitable for both drinking and agricultural purpose. Sulphate type is suitable for irrigation. Pre monsoon (Figure 16a) samples are mostly bicarbonate type. Post monsoon (Figure 16b) samples are bicarbonate to sulphate type. Sulphate type groundwater is more in post-monsoon water samples
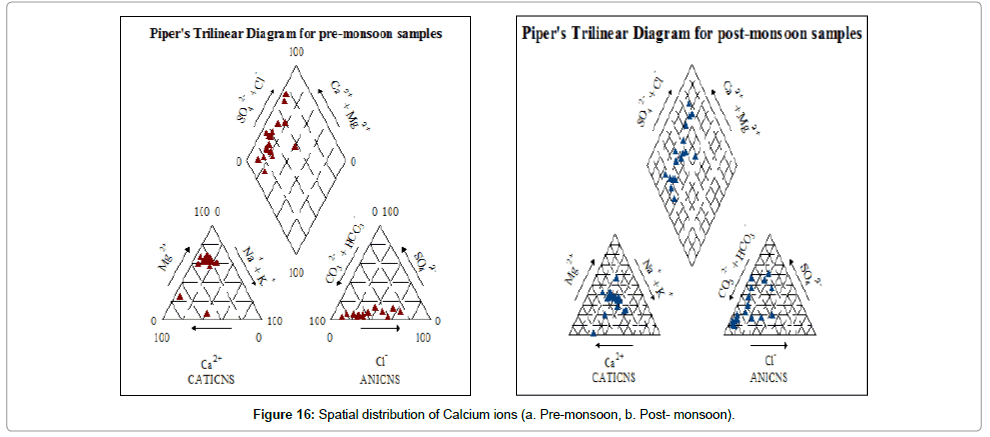
Figure 16: Spatial distribution of Calcium ions (a. Pre-monsoon, b. Post- monsoon).
Water quality indices: The idea of Water Quality Index (WQI) to classify water quality according to grades was first proposed by Horton [60]. The quality of groundwater, be it suitable for consumption or not, is determined with the help of this quality index measure [61].
To determine the WQI of the groundwater samples, standard and permissible values of ions present in water have been considered [62,63].
WQI indicates a single number like a grade that expresses the overall water quality at a certain area and time based on several water quality parameters.
Wi = 1/ Si (7)
Where, Wi is weightage factor and Si is the highest permitted value of parameter as given by WHO.
Qi= {[(Vactual- Videal)/ (Vstandard- Videal)]*100} (8)
Where, Qi is quality rating of parameter, Vactual is the mean value of a parameter as obtained from analysis of field samples, Vstandard is value of water quality parameter as proposed by WHO, Videal is zero for all parameters except pH where Videal = 7.
WQI = Wi*Qi (9)
During pre-monsoon period (Figure 17a), 12% samples are excellent, 65% are good and 24% are poor based on Water Quality Indexing. During post-monsoon period (Figure 17b), 18% samples are excellent, 41% samples are good, 32% samples are poor and 65 samples are very poor in terms of Water Quality Indexing.
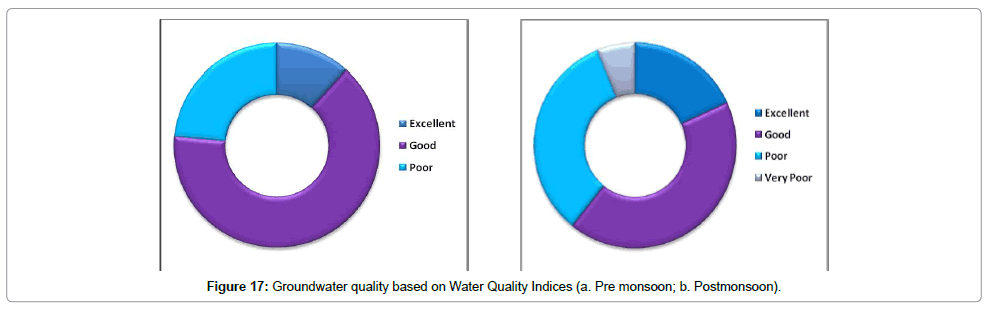
Figure 17: Groundwater quality based on Water Quality Indices (a. Pre monsoon; b. Postmonsoon).
Gibb’s diagram: The chemical quality of groundwater of an area is naturally influenced by three processes, namely- evaporation, precipitation and rock-water interaction. Which of these three processes is dominant in the study area can be determined with the help of Gibb’s [64] Diagram. Both pre- and post-monsoon samples (Figures 18 and 19) indicate that rock-water interaction is the dominant process in the study area.
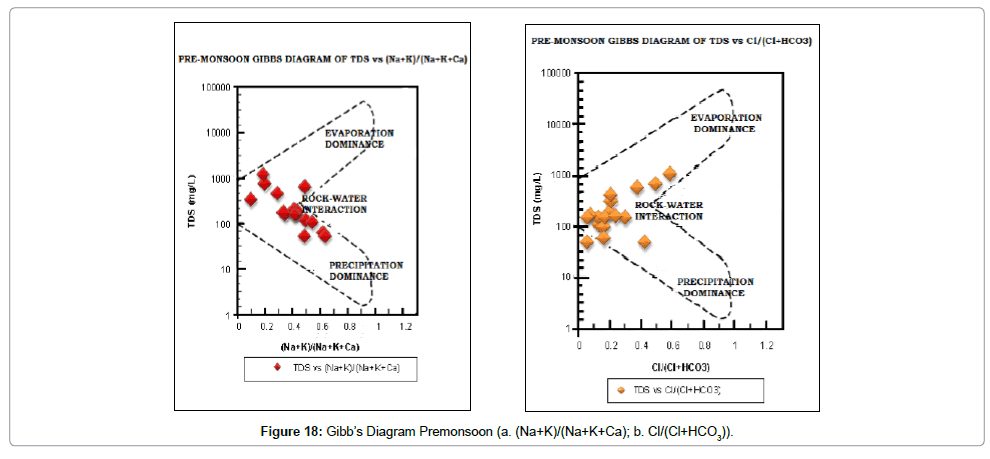
Figure 18: Gibb’s Diagram Premonsoon (a. (Na+K)/(Na+K+Ca); b. Cl/(Cl+HCO3)).
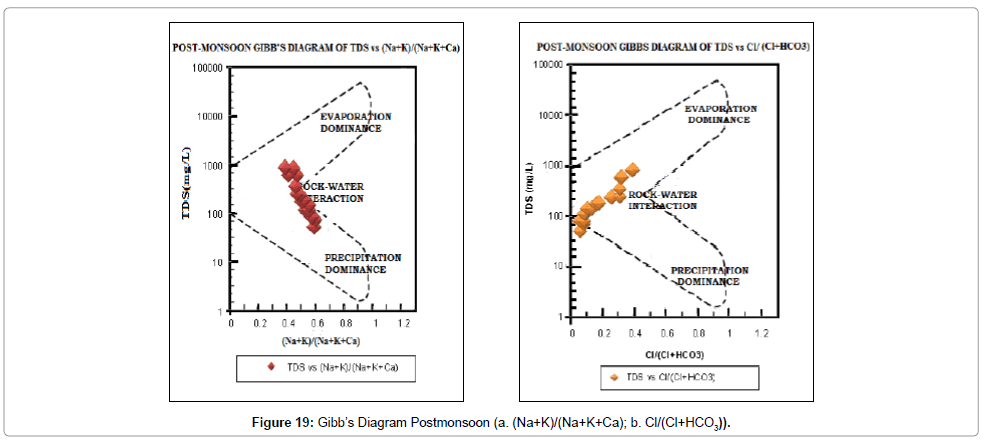
Figure 19: Gibb’s Diagram Postmonsoon (a. (Na+K)/(Na+K+Ca); b. Cl/(Cl+HCO3)).
Conclusion
The groundwater quality of Rajnagar Block of Birbhum District, West Bengal has been evaluated for its suitability with respect to irrigational and domestic works. Chemical analysis results indicate that the dominant cations in the study area are calcium and magnesium and the dominant anions are bicarbonate and sulphate. Hydrochemical facies analysis reveals that groundwater in the area is mostly of alkaline (bicarbonate type) nature except for some sulphate type samples in post-monsoon period. The electrical conductivity values and total dissolved solids values of water samples are all found to be within acceptable limits during both sampling sessions (Table 6). Total Hardness is also within the prescribed limits of WHO [65,66] except S2, S3, S4 samples in both the sessions. TH is also at higher level for S14 in post-monsoon and S15 in pre-monsoon sessions. Most of the water samples were found to be hard to moderately hard in nature. From correlation coefficient studies among different parameters, it is clear that EC and TDS show very good positive correlation with Na, Ca, Mg and Cl in post-monsoon while in pre-monsoon session good positive correlation is found between EC and TDS with Na, Mg, Cl and SO4. During pre-monsoon, good correlations are also exhibited between Na-HCO3 and SO4, Ca-K, Mg-Cl and SO4,Cl-SO4.
| Parameters | WHO international standard (1971, 1983) | Bore wells exceeding permissible limits | Undesirable effect | ||
|---|---|---|---|---|---|
| Most desirable | Maximum allowable | Post-monsoon | Pre-monsoon | ||
| pH | 7.0-8.5 | 9.2 | Nil | Nil | Taste |
| TDS (mg/L) | 500 | 1500 | Nil | Nil | Gastrointestinal irritation |
| TH (mg/L) | 100 | 500 | S2,S3,S4,S14 | S2,S3,S4,S15 | Scale formation |
| Na (mg/L) | -- | 200 | Nil | Nil | Health hazards |
| Ca (mg/L) | 75 | 200 | Nil | S2,S15 | Scale formation |
| Mg (mg/L) | 50 | 150 | Nil | S2 | |
| Cl (mg/L) | 200 | 600 | Nil | Nil | Salty |
| SO4 (mg/L) | 200 | 400 | S2,S12,S13 | Nil | Laxative |
Table 6: Groundwater samples exceeding permissible limits prescribed by WHO (1971,1983) for drinking purposes and their effect on human system.
Based on the calculated water quality parameters like SAR, SSP, MAR, PI and KR the suitability of groundwater samples are moderately suitable for irrigation in almost all cases. Magnesium Adsorption Ratio (MAR) value is quite high for both seasons. Although groundwater has low sodium content, but it may pose prominent alkaline hazard to soil, as reflected by the Residual Sodium Carbonate (RSC) values during post monsoon. Most of the water samples of pre-monsoon period have been found to be fit for drinking. Few of the post monsoon samples are unfit for drinking. There is no chance of salinity hazard. Thus the present study reveals that, for most of the parameters, more than 90% of the total number of samples are within permissible limits of drinking as well as irrigation, with a very few isolated exceptions.
The results from the chemical analysis data were used as a tool to identify the process and mechanisms controlling the chemistry of groundwater from the study area. The data of the area are plotted on the Gibbs’ diagram (Figures 18a, 18b, 19a and 19b). The samples fall in rock – water interaction zone indicating chemical weathering and dissolution of minerals as the prime factor influencing the groundwater quality.
Acknowledgements
The author (SKN) gratefully acknowledges the financial support from UGC Major Research Project [F. No. 41-1045/2012 (SR) Dated 23 Jul, 2012] in conducting the field work related to this work. The other author (S. Biswas) is thankful to CSIR, New Delhi and Jadavpur University also for providing the fellowship to her.
References
- Shah Tushaar (2009) Taming the Anarchy: Groundwater Governance in South Asia. Resources for the Future, Washington DC and International Water Management Institute, Colombo.
- Mercado A (1985) Use of hydrochemical pattern in carbonate, sand and sandstone aquifers to identify intrusion and flushing saline water. Groundwater 23: 635-645.
- Acheampong SY, Hess JW (1998)Hydeogeological and Hydrochemical Framework of the Shallow Groundwater System in the Southern Voltaian Sedimentary Basin, Ghana. Hydrogeology Journal 6: 527-537.
- Amadi PA, Ofoegbu CO, Morrison T (1989) Hydrochemical assessment of groundwater quality in parts of Niger Delta, Nigeria. Environ Geol Water Sci 14: 195-202.
- Garrels RM, Mackenzie FT (1967) Origin of the Chemical Compositions of Some Springs and Lakes, In Equilibrium Concepts in Natural Water Systems. Stumm, W. Advances in Chemistry. American Chemical Society: Washington, DC.
- Subramani T,Elango L, Damodarasamy SR (2005) Groundwater quality and its suitability for drinking and agricultural use in Chithar River Basin, Tamil Nadu, India. Environmental Geology 47: 1099-1110.
- Subramani T, Rajmohan N, Elango L (2010) Groundwater geochemistry and identification of hydrochemical processes in a hard rock region, Southern India. EnvironMonit Assess 162: 123-137.
- Vazquez Sunne E, Sanchez Vila X,Carrera J (2005) Introductory review of specific factors influencing urban groundwater, an emerging branch of hydrogeology, with reference to Barcelona, Spain. Hydrogeology Journal 13: 522-533.
- WHO (2011) Guidelines for drinking water quality-fourth edition. Geneva, Switzerland.
- Bureau of Indian Standards (BIS) 1991 “Drinking Water†1st Revision. Govt. of India, New Delhi.
- Al-Futaisi A, Rajmohan N, Al-Touqi S (2007) Groundwater quality monitoring in and around Barka dumping site, Sultanate of Oman. The Second IASTED (The International Association of Science and Technology for Development) International Conference on Water Resources Management (WRM 2007), Honolulu, Hawaii, USA.
- Jalali M (2006) Chemical characteristics of groundwater in parts of mountainous region, Alvand, Hamadan Iran. Environ Geol 51: 433-446.
- Pritchard M, Mkandawire T, O’Neill JG (2008) Assessment of groundwater quality in shallow wells within the southern districts of Malawi. PhysChem Earth 33: 812-823.
- Rivers CN, Hiscock KM, Feast NA, Barrett MH, Dennis PF (1996)Use of nitrogen isotopes to identify nitrogen contamination of the Sherwood sandstone aquifer beneath the city ofNottingham, UK. Hydrol J 4: 90-102
- Nag SK, Lahiri A (2012) Hydrochemical Characteristics of Groundwater for Domestic and Irrigation Purposes in Dwarakeswar Watershed area, India. American Journal of Climate Change 1: 217-230.
- Nag SK, Ghosh P (2013) Variation in Groundwater Levels and Water Quality in Chhatna Block, Bankura District, West Bengal - A GIS Approach. Jour GeolSoc India 81: 261-280.
- Nag SK (2014) Evaluation of hydrochemical parameters and quality assessment of the groundwater in Gangajalghati Block, Bankura District, West Bengal, India. Arabian Journal for Science and Engineering 39: 5715-5727.
- Das S, Nag SK (2015) Deciphering groundwater quality for Irrigation and Domestic Purposes - a case study in Suri I and II Blocks, Birbhum District, West Bengal, India. J Earth Sys Sci 124: 965-992.
- Tiwari AK, Singh PK, Mahato MK (2016) Hydrogeochemical investigation and qualitative assessment of surface water resources in West Bokaro Coalfield, India. Jour GeolSoc India 87: 85-96.
- Aghazadeh N, Mogaddam AA (2010) Assessment of Groundwater Quality and its Suitability for Drinking and Agricultural Uses in the Oshnavieh Area, Northwest of Iran. Journal of Environmental Protection 1: 30-40.
- Raji BA, Alagbe SA (1997) HydrochemicalFacies in Parts of the Nigerian Basement Complex. Environmental Geology 29: 46-49.
- Hossien MT (2004) Hydrochemical evaluation of groundwater in the Blue Nile Basin, eastern Sudan, using conventional and multivariate techniques. Hydrogeology Journal 12: 144-158.
- Guler C, Thyne GD (2004) Hydrologic and geologic factors controlling surface and groundwater chemistry in Indian Wells-Owens Valley area, southeastern California, USA. Journal of Hydrolog 285: 177-198.
- Schiavo MA, Havser S, Gusimano G, Gatto L (2006) Geochemical characterization of groundwater and submarine discharge in the south-eastern Sicily. Continental Shelf Research 26: 826-834.
- Kaka EA, Akiti TT, Nartey VK, Bam EPK, Adomako D (2011) Hydrochemistry and evaluation of groundwater suitability for irrigation and drinking purposes in the southeastern Volta river basin: manyakrobo area, Ghana. Elixir Agriculture 39: 4793-4807.
- Tripathy JK, Panigrahy RC (1999) Hydrochemical assessment of groundwater in parts of south coastal Orissa, India. Journal of Environmental Hydrology 7: 1-9.
- Rajesh R,Brindha K,Murugan R, Elango L (2012) Influence of hydrogeo chemical processes on temporal changes in groundwater quality in a part of Nalgonda district, Andhra Pradesh, India.Environmental Earth Sciences 65: 1203-1213.
- Reddi KR, Jayaraju N, Suriyakumar I and Sreenivas K (1993) Tidal fluctuation in relation to certain physic-chemical parameters in Swarnamukhi river estuary, East Coast of India. Ind Jour Mari Sci 22: 223-234.
- Rajmohan N, Elango L (2004) Identification and evolution of hydrogeochemical processes in the groundwater environment in area of the Palar and Cheyyar River Basins, South India. Environmental Geology 46: 47-61.
- Umar R, MMA Khan and AAbsar (2006) Groundwater Hydrochemistry of a Sugarcane Cultivation Belt in Parts of Muzaffarnagar District, Uttar Pradesh, India. Environmental Geology 49: 999-1008.
- Subba Rao N (2006) Seasonal variation of groundwater quality in a part of Guntur District, Andhra Pradesh, India. Environ Geol 49: 413-429
- Singh AK, Mondal GC, Kumar S, Singh TB, Tewary BK, et al. (2008) Major ion chemistry, weathering processes and water quality assessment in upper catchment of Damodar River basin, India. Environ Geol 54: 745-758.
- Srinivasamoorthy K, Chidambaram S, Prasanna MV, Vasahavihar M, Peter J and Anandhan P (2008) Identification of major sources controlling groundwater chemistry from a hard rock terrain - A case study from Metturtaluk, Salem district, Tamil Nadu, India.J Earth SystSci 117: 49-58.
- Mishra D, Mudgal M, Khan MD, Padmakaran P, Ckahradhar B (2009) Assessment of groundwater quality of Bhavnagar region (Gujarat). Journal of Scientific & Industrial Research 68: 964-966.
- Nagarajan R, Rajmohan N, Mahendran N, Senthamilkumar S (2009) Evaluation of groundwater quality and its suitability for drinking and agricultural use in Thanjavur city, Tamil Nadu, India. Environ Monit Assess 171: 289 - 308.
- Ramakrishnaiah CR, Sadashivaiah C, Ranganna G (2009) Assessment of water quality index for ground water in TumkurTaluk, Karnataka state, India. EJ Chem 6: 523-530.
- Mathur R, Suthar AK, Sharma R, Sharma A, Sharma S (2010) Assessment of ground water quality of Rajasthan with special reference to Jodhpur and Barmer region. Int J ChemSci 8: 1992-1998.
- Rout C, Sharma A (2011) Assessment of drinking water quality: A case study of Ambala cantonment area, Haryana, India. International Journal of Environmental Sciences 12: 933-945.
- MangukiyaR, Bhattacharya T, Chakraborty S (2012) Quality characterization of groundwater using water quality index in Surat city, Gujarat, India, Int Res J Environment Sci 1: 14-23.
- Pichaiah S, Senthil Kumar GR, Srinivasamoorthy K, Sarma VS (2013) Hydrochemical characterization and quality assessment of groundwater in TirupurTaluk, Tamil Nadu, India: Emphasis on irrigation utility. Journal of Academic Industrial Research 1: 805-812.
- Vasanthavigar M, Srinivasamoorthy K, Vijayaragavan K, Rajiv Ganthi R, Chidambaram S, et al. (2010) Application of water quality index for groundwater quality assessment: Thirumanimuttar sub-basin, Tamilnadu, India. Environ Monit Assess 171: 595-609.
- Karunakaran C, Sinha Roy S (1971) Laterites of BirbhumDist, West Bengal: Their origin and age. Rec. Geol. Surv. India, 98: 16-40.
- APHA (American Public Health Association) 1995 Standard Methods for Examination of Water and Waste Water. American Public Health Association, American Water Works Association and Water Pollution Control Federation, Washington DC, USA.
- US Salinity Lab (1954) Saline and Alkali Soils - Diagnosis and Improvement of U.S. Salinity Laboratory. Agriculture Hand Book No.60, Washington.
- Freeze RA, Cherry JA (1979) Groundwater. Englewood Cliffs, NJ, Prentice Hall.
- Hem JD (1985) Study and interpretation of the chemical characteristics of natural water.3rdEdn.Scientific Publishers, US Geological Survey, Water Supply Paper 2254.
- Giggenbach WF (1988) Geothermal solute equilibria, Derivation of Na-K-Mg-Cageoindicators. GeochimCosmochimActa52: 2749-2765.
- AHA (American Heart Association) 2010 Dietary Guidelines. American Heart Association. 23 January 2009. Retrieved 16 May 2010.
- Kurumbein WC, Graybill FA (1965) An introduction to statistical models in geology. McGraw-Hill, New York.
- Ishaku JM, Ahmed AS, Abubakar MA (2011) Assessment of groundwater quality using chemical indices and GIS mapping in Jada area, Northeastern Nigeria. J Earth SciGeotechEng1: 35-60.
- Obiefuna GI, Sheriff A (2011) Assessment of shallow ground water quality of PindigaGombe Area, Yola Area, NE, Nigeria for irrigation and domestic purposes. Res J Environ Earth Sci3: 131-141.
- Richards LA (1954) Diagnosis and Improvement of Saline and Alkali Soils, U. S. Department of Agriculture Handbook, 60 Washington DC, USA.160
- Todd DK (1980) Ground water hydrology (2nd Edn), John Wiley & Sons, New York.
- Wilcox LV (1955) Classi?cation and use of irrigation waters. USDA Circular 969, Washington.
- Doneen LD (1964) Notes on water quality in agriculture. In Water Science and Engineering Paper 4001.Dept. of Water, Science and Engineering, Univ. of California, Davis, USA.
- Raghunath HM (1987) Groundwater. ISBN-10: 0470206985, New Age International (P) Ltd. Publishers.
- Kelly WP (1963) Use of Saline Irrigation Water. Soil Sci 95: 355 - 391.
- Piper AM (1944) A graphic procedure in geochemical interpretation of water analyses, Trans AmGeophys Union 25: 914-923.
- Â Horton RK (1965) An Index number system for rating water quality. J Water Poll Cont Fed 37: 300-305.
- Tiwari TN, Mishra M (1985) A preliminary assignment of water quality index of major Indian rivers. Indian J Environ. Protect. 5: 276-279.
- Pradhan SK, Patnaik D, Rout SP (2001) Water quality index for the groundwater in and around a phosphatic fertilizer plant. Indian J Environ Protect 21: 355-358.
- Asadi JJ, Vuppala P, Reddy MA (2007) Remote sensing and GIS techniques for evaluation of groundwater quality in Municipal Corporation of Hyderabad (Zone-V), India Int J Environ Res.Public Health 4: 45-52.
- Gibbs RJ (1970) Mechanisms Controlling World’s Water Chemistry. Science 170: 1088-1090.
- WHO (1971) International standards for drinking water. World Health Organisation, Geneva.
- WHO (1983) Guidelines to drinking water quality. World Health Organisation, Geneva, pp 186.
Citation: Nag SK, Suchetana B (2016) Groundwater Quality and its Suitability for Irrigation and Domestic Purposes: A Study in Rajnagar Block, Birbhum District, West Bengal, India. J Earth Sci Clim Change. 7: 337. Doi: 10.4172/2157-7617.1000337
Copyright: © 2016 Nag SK, et al. This is an open-access article distributed under the terms of the Creative Commons Attribution License, which permits unrestricted use, distribution, and reproduction in any medium, provided the original author and source are credited.
Share This Article
Recommended Journals
Open Access Journals
Article Tools
Article Usage
- Total views: 16380
- [From(publication date): 2-2016 - Jun 29, 2024]
- Breakdown by view type
- HTML page views: 15057
- PDF downloads: 1323