Research Article Open Access
Bacterial Isolation from Palm Oil Plantation Soil for Biodiesel Production: Isolation and Molecular Identification as Inferred by 16s RNA
Meng Liu1,2*, Mashitah Mohd Yusoff1,2,3, Essam A Makky2 and Jailani Salihon41Biotechnology Cluster Industrial Center of Excellence, Universiti Malaysia Pahang, 26300 Gambang, Pahang, Malaysia
2Faculty of Industrial Sciences & Technology, Universiti Malaysia Pahang, 26300 Gambang, Pahang, Malaysia
3Central Laboratory, Universiti Malaysia Pahang, 26300 Gambang, Pahang, Malaysia
4Faculty of Chemical and Natural Resources Engineering, University Malaysia Pahang
- Corresponding Author:
- Meng Liu
Biotechnology Cluster Industrial Center of Excellence
Universiti Malaysia Pahang
26300 Gambang, Pahang, Malaysia
E-mail: liuzhizi616@gmail.com
Received date: April 10, 2014; Accepted date: May 15, 2014; Published date: May 22, 2014
Citation: Liu M, Yusoff MM, Makky EA, Salihon J (2014) Bacterial Isolation from Palm Oil Plantation Soil for Biodiesel Production: Isolation and Molecular Identification as Inferred by 16s RNA. J Biotechnol Biomater 4:165. doi:10.4172/2155-952X.1000165
Copyright: © 2014 Liu M, et al. This is an open-access article distributed under the terms of the Creative Commons Attribution License, which permits unrestricted use, distribution, and reproduction in any medium, provided the original author and source are credited.
Visit for more related articles at Journal of Biotechnology & Biomaterials
Abstract
Biodiesel (methyl esters) is a clean alternative fuel which can be produced from many renewable resources. Palm oil, like other vegetable oils, can be used as feedstock for biodiesel production through transesterification to produce palm oil methyl ester. Various microorganisms like bacteria and fungi have a diversity application which could be used as catalysts in a series of degradation reactions, such as transesterification. Malaysia is rich in palm oil and therefore, lots of bacteria surviving by consuming palm oil residue resource in palm oil plantation. In this study, eighteen (18) bacterial strains were successfully isolated from local soil samples and some of their characteristics determined. The optimum temperatures of all strains were in the range of 30 to 37°C, and the optimum batch culture times of all strains were in the range of 24 to 48 hours. All strains were submitted for Gram-staining. Three (3) strains denominated as A, B and C that was involved in the most significant transesterification reaction was selected for identification by submitting them to biochemical tests using the commercial API kit. The same three (3) isolates were submitted to identification by molecular technique. Two bacteria were identified to be Pseudomonas geniculata (A) and Stenotrophomonas maltoplilia (C), while the second bacteria (B) identified to be Bacillus pseudomycoides B-60.
Keywords
Biodiesel; Transesterification; Identification; PCR
Introduction
Microorganisms had existed on earth for billions of years before plants and animals appeared. Thus their evolutionary diversity has far outpaced that of higher organisms. This huge diversity accounts for some of the spectacular properties of microorganisms [1].
The release of microorganisms from soil samples is routine in the microbiological genetic diversity of soil bacteria is high and that soil contains many bacterial species of lineages for which no known cultivated isolate are available laboratory. The literature is extensive [2]. It has been established that the many soil bacteria are referred to as uncultured or even non-culturable [3].
The diversity of the bacterial kingdom is reflected by the diverse applications of bacteria as a cheap labour force. Normally all microorganisms produce enzymes e.g. lipase to be catalysts in each microorganisms own metabolism, so a lot of applications were based on this fact [4]. To produce biodiesel biologically is an emerging technique, with the assumption that a certain environment could be the ideal condition for some microorganism, where they are able to grow under that condition and consume the limited nutrition to produce biodiesel [5].
As a result, a lot of bacteria had been used to convert vegetable oil into biodiesel in order to find an ideal enzyme to replace the traditional chemical methods. Moreover, it is friendly to the environment and above all it is easy to separate after the reaction, as identified in previously completed research [6].
In Malaysia, the land area is covered by massive oil palm plantations, and the country is well-known for its palm oil products. Malaysian oil palm plantation soil is an ideal place for thousands of microorganisms. In addition, countless oil palm fruits were left on the surface of the earth or buried, having penetrated into soil. As a result, most probably there are a lot of microorganisms which would be able to live by consuming palm oil directly or indirectly [7].
Pseudomonas aeruginosa, an obligate aerobe, is found in many natural and man-made environments; it has been isolated from plants and soils [8,9]. Identification of P. aeruginosa in the laboratory is generally performed by growing the bacteria on either cetrimide agar or nalidixic acid-cetrimide agar. This species can grow in low-nutrient water [10] and survive for long starvation periods [11] which are often related to biofilm formation [12]. In addition to being a primary infectious agent, P. aeruginosa is an indicator of other opportunistic pathogens and also even promotes these microorganisms [13]. Polymerase chain reaction (PCR) methods, which allow for more rapid identification of P. aeruginosa by DNA amplification, have been reported [14]. Pseudomonas luteola, also as known as Chryseomon luteola, is a Gram-negative rod [15]. P. luteola is aerobic, non-sporeforming, motile, oxidase-negative and catalase-positive [16]. Recent analysis of the 16S rRNA sequences of this organism suggests that Chryseomonas and Pseudomonas are related and that Chryseomonas is a junior subjective synonym of Pseudomonas [15]. A number of enzyme application have been found from Pseudomonas such as direct esterification, acrylate synthesis, as well as the Ps. luteola lipase illustrated a role of lid in interfacial activation and the conformation of the enzyme in organic media [17].
Stenotrophomonas maltophilia, previously named Pseudomonas, and then Xanthomonas maltophilia, has been recently classified as the single species of the new genus Stenotrophomonas. S. maltophilia is a non-fermentative Gram-negative bacillus which grows readily on most bacteriological media [18,19]. Several factors confer S. maltophilia plays a role in the promising pathogen, especially capability to elaborate a abroad span of additional cellular enzymes, for example lipase, fibrolysin, and proteases, potentially involved in the colonization process [20]. Molecular typing systems have contributed to knowledge of the epidemiology of S. maltophilia infections. Typing methods such as ribotyping [21], multilocus enzyme electrophoresis [22,23], random amplification of polymorphic DNA [24], enterobacterial repetitive intergenic consensus-PCR [25] and DNA macro restriction analysis [26] have been employed.
It was reported that the transesterificatin of several vegetable oils by bacterial lipases, including Pseudomonas lipase, showed a stronger activity, compared to fungal lipases such as Lipozyme TL IM [27].
The present study focuses on the isolation and identification of some unknown microorganisms from a local oil palm plantation soil. The investigation will conclude the morphology and growth characteristics of these microorganisms. In this study, three strains were investigated by API20-E kit and PCR amplification, so that the identification of three strains was carried out by sequence analysis.
Materials and Methods
Chemicals
Microbiological agar, liquid broth media and Gram-staining reagents were supplied by Merck, Malaysia Division. API-20 E Kit was purchased from Fisher Scientific (M) Sdn. Bhd. G-spin Genomic DNA extraction kit (for bacteria) and MEGAquick-spin PCR & Agarose Gel DNA Extraction System were purchased from Intron Biotechnology, Inc. Agarose power was purchased from Biosyntech Sdn. Bhd. SYBR safe DNA gel stain and 1 Kb plus DNA ladder were purchased from Invitrogen, USA. TAE-buffer was purchased from DKSH Technology Sdn. Bhd. Taq DNA polymerase, MgCl2 and 10 X Buffer were purchase from Invitrogen, USA.
Isolation, purification and screening of lipase bacterial
Soil samples were collected from the oil palm plantation of LKPP (Lembaga Kemajuan Perusahaan Pertanian) Lepar Hilir, Jalan Muadzam-Kuantan, Pahang, Malaysia. Two types of sampling sites were selected namely common agriculture sand and agriculture soil which has been covered with fertilizer for a very long time, as palm fruits were usually fell down from trees on the soils.
Soil samples were taken to the laboratory and stored overnight at 4°C. An amount of 10 g of each soil sample was weighed, sieved and added to 90ml prepared sterile distilled water. Each sample was stirred and diluted from 10-1 to 10-8 dilution factor. Then, an amount of 100 μl from each dilution was inoculated into prepared petri dishes containing sterile nutrient agar. The plates were inverted and placed in the incubator at 30oC for three (3) days.
Lipase bacterial screening was performed to find the lipase with the best catalytic activity in the transesterification of palm oil [28]. All bacteria were mixed with palm oil and methanol in a certain ratio. These initial crude activity tests were used to screen the bacterial isolates with significant activity, and to select them to carry out further experiments on. The screening experiments were intended for evaluation of the activity of the lipases from different sources. In a typical reaction, 10% V/V of crude enzymes were added to the mixture of 6 ml of palm oil, 2.4 ml methanol (3 M ratio of methanol to palm oil), with 150 rpm constant stirring at 40°C for 5 hours. The analysis of palm oil (Fatty Acid Methyl Ester) content in the samples was carried out using Gas Chromatography (GC) by means of Inert DP WAX capillary column (30 mx0.25 mm, I.D. 0.25 um). Helium was used as the carrier gas. Oven temperature program was as follows: 155°C for 1 min and programmed from 155 to 180°C at a rate of 2°C/min, kept for 2 min, and finally raised to 220°C at 4°C/min and maintained for 6 min. The injector was set up for 250°C and the FID detector at 260°C.
Biochemical characterization of bacterial strains and Genomic PCR amplification
The biochemical characterization of potential bacterial isolates was performed as per standard protocol for biochemical tests [29]. After the successful isolation from soil, a number of bacteria were sub-cultured and their morphology was observed. Eighteen bacterial isolates were subjected to Gram-staining procedure and morphological characteristics. The API-20E test kits were performed following the manufacturer’s instructions. The results were interpreted with the APILAB PLUS software (version 3.3.3).
Modified 16S r-RNA sequence [30] primers for PCR based on the API -20E results was used, these sequences were filed in the international gene banks. Two oligos universal primers were designed for use in PCR. The first forward primer (F: 5’ AGA GTT TGA TCC TGG CTC AG3’) and one reverse primer (R: TAC GGY TAC CTT GTT ACG ACT T3’) for use in initial PCR amplification. The concentration of samples DNA was estimated by measurement of absorbency at 260 nm on a spectrophotometer. Amplification conditions were run for 30 cycles. A typical reaction mixture in each PCR tube for 20 μl total volume, containing 1 μl of the appropriate dilutions of DNA, 2 μl of 10X PCR reaction buffer, 0.5 μl of DNA polymerase, 0.5 μl of d-NTPs, 1 μl of MgCl2, 1 μl of each primer. PCR involved initial denaturation at 94°C for 1 min, five cycles with a low annealing temperature of 50°C for 5 s, extension at 72°C for 30 s and heated to 94°C for 5 s, and additional 25 cycles of denaturation at 92°C for 2 s, annealing temperature at 55°C for 2 s, extension at 72°C for 30 s and final extension at 72°C for 2 min. The PCR products were then separated on a 1% agarose gel containing 1 mM ethidium bromide for visualization on a Bio-imaging machine. Interesting DNA fragment was cut out with a sharp scalpel after PCR product electrophoresis and was taken carefully as much as agarose gel as possible. The mixture was shaking and incubate at 55°C for 10 minutes or until the gel is completely dissolved. The dissolved gel mixture was transferred to the kit column assembly and centrifuged for 1minute; the flow-through was discarded after centrifuge. 700 μl of washing buffer was added to column and centrifuged at 13,000 rpm for 1 minute and discarded the flow-through. The column was placed to a clean 1.5 ml micro-centrifuge tube after centrifuge for 1 min at 13,000 rpm to dry the spin membrane. 60 μl of the elution buffer was directly applied to the centre of the column without touching the membrane with the pipette tip. The tube was incubated at room temperature for 1 min and centrifuged for 1 min at 13,000 rpm. Lastly tubes were stored at -20°C.
Sequence Analysis and Blast Analysis
The PCR products were sent to expert company (1st BASE, USA) to analyse the sequence, and then Blast the sequence with Gene bank.
Results and Discussion
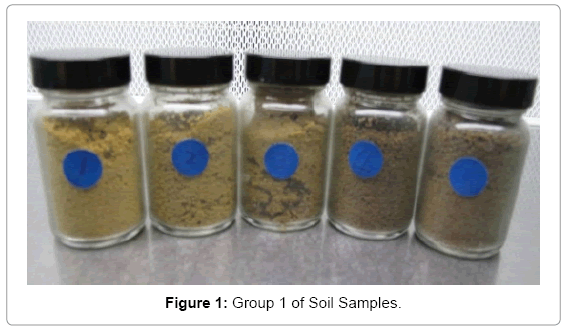
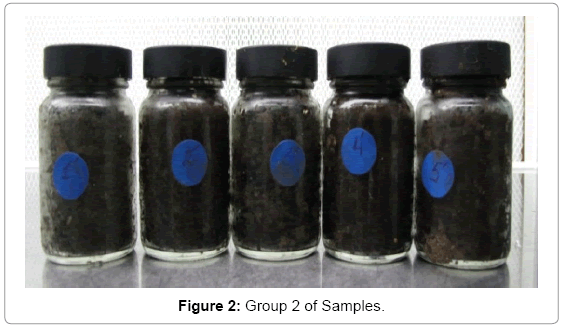
All the samples were collected from 2 sampling sites. The two groups of samples have a distinctive colour difference. Group 1 is from agriculture sand soil and is shown in Figure 1, the group 2, form fertilized agriculture soil is shown in Figure 2. It was observed that samples from group 2 have a darker colour than group 1 which indicates a rich in nutrient from palm oil waste fertilizer.
The use of serial dilution to obtain bacterial isolates which are significant in or at least typical of a habitat has been employed to isolate micro-bacteria. Several dominant cell types were observed in the different plates in which growth occurred. In various series dilution, mixture of cell types was present. Besides very small and quite large rod-shaped organisms and cocci shape could also be recognized under microscope. As in the previous description of the methods, a lot of colonies were cultured in the first three days. From these, independent and single colonies were chosen for sub-culture; the sub-culturing process proceeded along with the same methods and using the same medium. As many as eighteen (18) bacterial isolates were successfully isolated from soil samples and labelled from A to R. On the basis of the taxonomical characteristics of all 18 strains, some of them are not only identical in morphology, but also similar in Gram-staining. As a result, eleven (11) isolates were selected as typical species and their morphological characteristics are shown in Table 1. Of all the isolated isolates, as many as 13 of them were from group 2 soil, namely the fertilized agriculture soil, with the rest was from the group 1.
| Isolates Code | Colour | Isolate Colony | Form | Gram-stain | Cell Shape | Sample Group |
|---|---|---|---|---|---|---|
| Size(μm) | ||||||
| A | White | 10 | Floral | Positive | Bacilli | 1 |
| B | Pale yellow | 5 | Cream/Irregular | Negative | Strepto, bacilli | 2 |
| C | Yellow | 10 | Oval | Negative | Bacilli | 1 |
| D | White | 10 | Irregular | Negative | Bacilli | 1 |
| E | Light Yellow | 10 | Oval | Negative | Worm Shape | 2 |
| F | Brown | 5 | Irregular | Negative | Cocci | 1 |
| G | White | 5 | Irregular | Positive | Bacilli | 1 |
| H | White | 10 | Flat | Positive | Bacilli | 1 |
| I | Yellow | 5 | Oval | Positive | Bacilli | 2 |
| J | Pale yellow | 10 | Irregular | Negative | Cocci | 1 |
| K | White | 5 | Cream/Irregular | Negative | Bacilli | 1 |
Table 1: Morphological Characteristics of 11 Bacterial Isolates.
The growth conditions of eleven (11) bacterial isolate are summarized in Table 2 below. The first step was monitoring the parameters of culturing on the nutrient agar; from these results it was found that they all could easily survive on the nutrient agar; and their growth were fast. Most bacteria have growth temperature of 30-37°C .The result was in line with the concept; the incubation temperature of bacterial isolate in this research was either 30°C or 37°C. For the incubation period, the longest was no more than 48h. Inversely, the lowest incubation period was at least 24 hours, with most bacteria can survive from 24- 48 hours on the agar plate.
| Isolate | Bact. growth Temperature (℃) on Agar Medium | Incubation Time (h) | ||||
|---|---|---|---|---|---|---|
| Code | Agar Medium | Broth Medium (OD) | ||||
| 30 | 37 | 24 | 30 | 48 | 24 | |
| A | +++ | ++ | ++ | +++ | +++ | 155 |
| B | +++ | + | ++ | +++ | +++ | 125.7 |
| C | ++ | +++ | + | ++ | +++ | 121 |
| D | +++ | ++ | + | ++ | +++ | 123.5 |
| E | ++ | + | + | ++ | +++ | 117.6 |
| F | + | +++ | + | ++ | +++ | 112.2 |
| G | +++ | ++ | + | ++ | +++ | 115.6 |
| H | ++ | + | + | ++ | +++ | 124.7 |
| I | ++ | +++ | + | ++ | +++ | 118 |
| J | + | +++ | ++ | ++ | +++ | 120.2 |
| K | +++ | + | + | ++ | +++ | 117.1 |
Table 2: Determination of bacterial growth at Different Conditions. +: Weak Growth; ++: Moderate Growth; +++: Heavy Growth
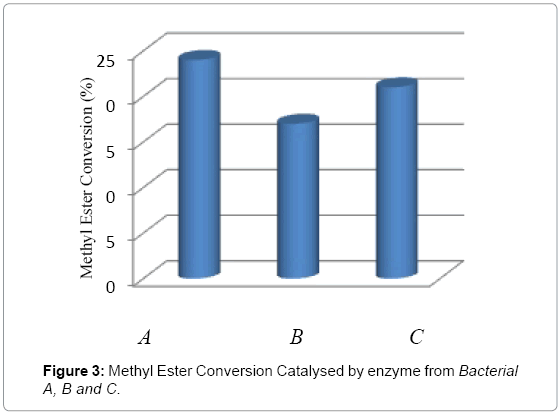
In this study, all eleven (11) bacteria were tested for the conversion reaction under the same conditions. After determination by Gas Chromatography, only three bacteria gave positive result, namely bacterial A, B and C. Further all these lipases were screened for biodiesel synthesis from crude palm oil and methanol. The catalytic activities of three lipases on transesterification were compared in Figure 3; all three lipases show conversion activity during the transesterification from palm oil to methyl esters. The methyl ester conversion of oil by using lipase from bacterial A is around 24% and methyl ester conversion of lipase from bacterial B showed comparable higher catalytic activity around 21% as compared to lipase from bacterial C around 17%.
As the three isolates have positive activity in the screening of lipase from bacteria. Namely the importance of bacteria A, B and C is over the rest. So the following identifications also focus on these threes screens.
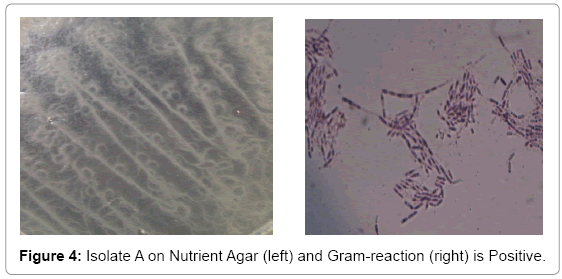
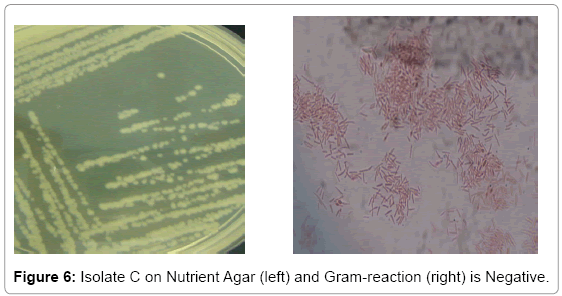
Bacterial isolate A gave a flowery-like shape on nutrient agar plate whereas in the Gram-staining procedure appeared Gram-positive rod shaped (Figure 4). For bacterial isolate B, the shape was round in nutrient agar plate whereas in Gram staining it was in Gram-negative rod shape (Figure 5). While bacterial isolate C the shape was also round in nutrient agar plate and bigger than isolate B but rod and Gramnegative reaction (Figure 6). In terms of colour they were white, violet and light brown respectively.
The API 20-E KIT results for biochemical test were given in Table 3. The identify of bacterial A is either as potential Pseudomonas aeruginosa or Pseudomonas fluorescens with strongly 97% test against oxidase test. For bacteria B, it is as potential Bacillus pseudomycoides at strongly 98% test against ONPG and 100% against oxidase. However, isolate C gave fairly percentage at CIT test at 94% and GLU at 84%, so fairly identified as either Pseudomonas luteola or Stenotropomonas maltophilia.
| Bacterial No. | Significant Taxa | % ID | T | Test Against |
|---|---|---|---|---|
| A | Pseudomonas aeruginosa | 77.5 | 0.77 | OX 97% |
| Pseudomonas fluorescens/putida | 15.6 | 0.65 | OX 99% | |
| B | Pseudomonas luteola | 70.8 | 0.71 | ONPG98% LDC25% CIT 25% IND85% |
| Stenotrophomonas maltophilia | 21.5 | 0.25 | OX 100% | |
| C | Pseudomonas luteola | 61.7 | 0.44 | CIT 94% GEL 13% GLU 84% ARA 85% |
| Stenotrophomonas maltophilia | 25.7 | 0.34 | CIT 75% LDC 75% ADH 0% |
Table 3: The API Results of Bacterial A, B and C.
Concerning the additional assays tested, some biochemical tests showed false negatives and false positives. Consequently, this procedure should be discarded as a confirmative test. In contrast, the API 20-E system proved a powerful tool as it correctly identified all the confirmed isolates. This commercial system could be used by qualified laboratories when dealing with isolates of dubious identification [31].
The OD values of the three bacteria were tested before DNA extraction, to quantify the bacteria, and the results are listed in Table 4. In 1.5 ml samples, under the 260 nm of UV-VIS detection, the average of two readings for isolate A has the lowest value of 0.86 ± 0.01, the value for isolate B is 1.89 ± 0.01, meanwhile the isolate C gives the highest value of 2.01 ± 0.01.
| Bacterial isolate | OD Value (600nm)(24hours) | Mean ± SD | |
|---|---|---|---|
| Reading 1 | Reading 2 | ||
| Control (Distilled water) | 0.002 | 0.001 | 0.01 ± 0.01 |
| A | 0.869 | 0.846 | 0.86 ± 0.01 |
| B | 1.896 | 1.879 | 1.89 ± 0.01 |
| C | 2.013 | 2.014 | 2.01 ± 0.01 |
Table 4: The OD Value of Bacteria.
These values were in line with the lowest value by the DNA extraction protocol from the manufacture of the commercial kit. Hence it proved that all three bacteria were at suitable optical densities after incubation period for 24 h. They were all suitable to be used for the DNA extraction, since the high cells density gave an assurance of the extraction.
The DNA extraction was carried out by agarose gel electrophoresis and the results are shown in the Figure 7 M is 1 kb maker ladder; the rest are the three bacteria, namely A, B and C. A has a brilliant band of 5,000 bp and a fade band of 12,000 bp; the bacteria B has a faded band; by contrast, the bacteria C has two brilliant bands, both at 12,000 bp and 5,000 bp. From the bands results, bacteria B has a faded band, the reason was probably due to DNA molecular mass being too big to move through the gel. Nucleic acid molecules are separated by applying an electric field to move the negatively charged molecules through an agarose matrix. Shorter molecules move faster and migrate farther than longer ones because shorter molecules migrate more easily through the pores of the gel. This phenomenon is called sieving [32].
The DNA extracted of the three bacterial isolates were quantified by measuring the OD at 50 times dilution before PCR amplification, and the results are listed in the Table 5. In the 50 times diluted sample of bacteria, under the 260 nm of UV-VIS detection, the calculation showed that bacteria A has the concentration at 121.7 ng/μl, the bacteria C was 147.5 ng/μl, meanwhile the bacteria B gives the highest concentration up to 166.7 ng/μl.
| Bacteria isolate | OD Value (260nm) | Average Value( ± SD) | DNA Concentration (ng/μl) | |
|---|---|---|---|---|
| Reading 1 | Reading 2 | |||
| Control (Distilled Water) | 0 | 0 | 0 | 0 |
| A | 0.048 | 0.051 | 0.0495 ± 0.0001 | 121.7 |
| B | 0.066 | 0.069 | 0.0675 ± 0.0001 | 166.7 |
| C | 0.06 | 0.058 | 0.059 ± 0.0001 | 147.5 |
Table 5: The Concentration of Bacterial DNA.
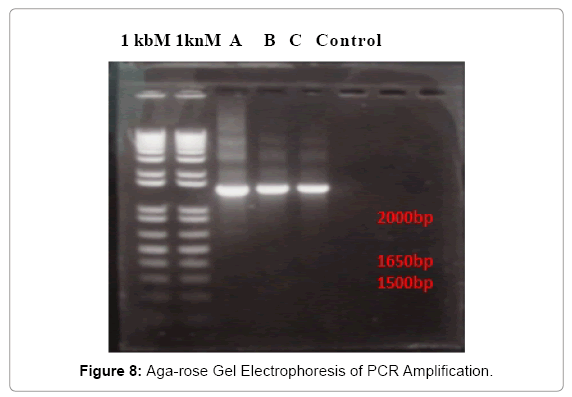
In fact, the UV-VIS result is not only able to test the DNA concentration, but also test the purity of DNA, the purpose is to detect the DNA samples which were suitable to ensure the possibility of success of or the good results the PCR reaction. To evaluate the sensitivity of the species specific primers, extracted chromosomal DNA were amplified by PCR. The results of PCR amplification was shown in Figure 8. The 16S rRNA sizes of three bacteria were all between 1650 bp to 2000 bp, is mostly around 1650 bp.
The bands were very bright, which are indicates that the PCR amplification was successful and 16S rRNA was gotten after the running of PCR. The purification of PCR product was carried as well. The quantification indicator is the test for the concentration of PCR products, their results were shown in Table 6. The concentrations of 16S rRNA were all very much lower than the concentration of bacterial DNA in Table 6. The isolate A has a concentration of 78.8 ng/μl; B has the highest concentration of 93.8 ng/μl; and C has the lowest concentration of 65.0 ng/μl.
| Bacteria isolate | OD Value (260nm) | Average Value ± (SD) | 16S rRNA Concentration (ng/μl) | |
|---|---|---|---|---|
| Reading 1 | Reading 2 | |||
| Control (Distilled Water) | 0 | 0 | 0 | 0 |
| A | 0.032 | 0.031 | 0.0315 ± 0.01 | 78.8 |
| B | 0.038 | 0.037 | 0.0375 ± 0.01 | 93.8 |
| C | 0.025 | 0.027 | 0.026 ± 0.01 | 65 |
Table 6: The Concentration of Purified PCR Product.
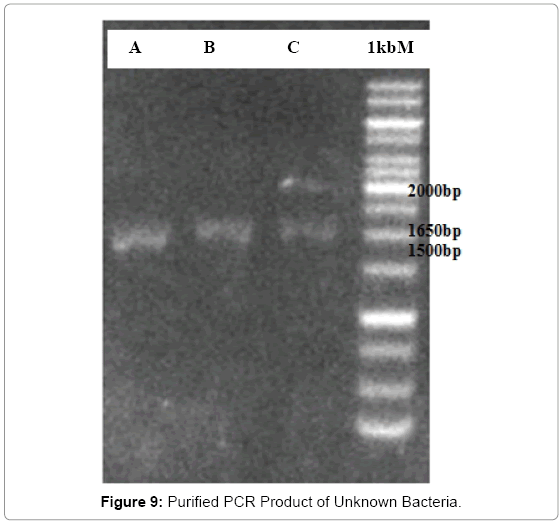
The electrophoresis of PCR product after purification were carried out, the results are as shown in the Figure 9; in the comparison with the standard, bacteria A has band of around 1700bp, the band of bacteria B seems identical with the band of bacteria C is around 1710bp. The bands that appeared confirmed that the desired gene was contained in each PCR product which has been purified. All bands were very faint compared with the standard; this was due to the fact that the amount of DNA was reduced after purification. For this reason, the unknown bacteria gene was more difficult to be amplified. In addition, the following DNA purification procedure further reduced the amount of the unknown bacterial gene. Therefore, it was normal that the gene bands became faint.
The most important result, the identification by molecular test, is the BLAST on the gene bank website. BLAST for all bacteria was carried out to prove what kind of bacteria they are. The sequences producing significant alignments, concluded a lot of species genus. For bacteria A, it has a description of Pseudomonas geniculata strain in the Max identification, though it is not exactly in line with the API-20E kit result. It nearly approached the Pseudomonas aeruginosa, normally the molecular test has an exact identification, so the unknown bacteria A is presently named as Pseudomonas geniculata NBG2 strain for which the max identification is 100%. For unknown bacteria B, its identification by molecular test has no connection with biochemical test by API kit 20E. The molecular test proved that the bacterial isolate is probably Bacillus Sp. or Bacillus pseudomycoides B-60, for which the max identification is above 97%. The third unknown bacteria C, has a max identification of 100% in the description of Stenotrophononas maltophilia AQN2, It has a best relationship with biochemical test by API-20E, so probably this primer is suitable with this bacteria.
To date, Laboratory accurate identification of P. aeruginosa has not been reported an imperative component of patient management and nosocomial infection control, there has been no single test that can reliably identify P. aeruginosa [30]. Previously reported the limitations of phenotypic methodologies including biochemical tests [33,34].
The identification of S. maltophilia by random primer is in line with random PCR which has proven effective in S. maltophilia typing when compared to gel electrophoresis (GE), it is a considerable pathway of choice [35], PCR is always a much powerful way to prove result reliable extent amongst two different amplification systems [36].
In conclusion, from results, most of the successfully isolated bacteria were from the fertilizer soil. The reason is probably that fertilization has a positive effect to help bacteria in degradation activities. As a result, the fertilizer soil is comparatively an excellent environment for bacteria. The universal primer designed was not efficient for the bacteria, moreover, only bacteria is absolutely not in line with the biochemical test. But by contrast, the molecular test gave an exact and persuaded finding on the identification, in the combination of the two methods for identification, It was reported that the transesterificatin of several vegetable oils by bacterial lipases, including Pseudomonas lipase, showed a stronger activity, compared to fungal lipases such as Lipozyme TL IM [27]. In this study, since the final results of methyl ester conversation rate by lipase from Pseudomonas qeniculata (pseudomonas aeruginosa) (24%) and lipase from Stenotorophomonas maltophilia (Pseudomonas luteola) (21%) were higher than that by lipase from Aeromonas hydrophila (Bacillus pseudomycoides) (17%); therefore, lipase from Pseudomonas aeruginosa and lipase from Stenotorophomonas maltophilia (Pseudomonas luteola) were considered as the most suitable lipase for transesterification reaction of crude palm oil and methanol to methyl ester.
Acknowledgements
This work was funded by University Malaysia Pahang.
References
- Staley JT, Richard W, Castenholz R and Colwell R(1997)The microbial world. American Society for Microorganism. (3th ed) Washington DC
- Riis V, Lorbeer H and Babel W(1997) Extraction of microorganism from soil: Evaluation of the efficiency by counting methods and activity measurements. Soil biology and Biochemistry. 30: 1573-1581.
- Perer H, Janssen L and Penelope S(2002) Improved culture ability of soil bacteria and isolation in pure culture of novel members of the divisions Acidobacteria, Actinobacteria, Proteobacteria, and Berrucomicrobia. Appl Environment Microbiol. 68: 2391-2396.
- Bull AT(2001) Biotechnology for industrial sustainability. Chemical and Engineering 18 : 137-148.
- Helwani Z and Othman MR(2009) Technologies for production of biodiesel focusing on green catalytic techniques: A review. Fuel Processing Technology90: 1502-1514.
- Dizge N, Aydiner C, Imer DY, Bayramoglu M, Tanriseven A(2009) Biodiesel production from sunflower, soybean, and waste cooking oils by transesterification using lipase immobilized onto a novel micro porous polymer. Bioresour Technol.100: 1983-1991.
- Kansedo J, Lee KT, Bhatia S (2009)Cerberaodollam (sea mango) oil as a promising nonedible feedstock for biodiesel production. Fuel. 8: 1148-1150.
- Römling U, Wingender J, Müller H, Tümmler B (1994) A major Pseudomonas aeruginosa clone common to patients and aquatic habitats. Appl Environ Microbiol 60: 1734-1738.
- Walker TS, Bais HP, Déziel E, Schweizer HP, Rahme LG, et al. (2004) Pseudomonas aeruginosa-plant root interactions. Pathogenicity, biofilm formation, and root exudation. Plant Physiol 134: 320-331.
- Moreira L, Agostinho P, Morais PV, da Costa MS (1994) Survival of allochthonous bacteria in still mineral water bottled in polyvinyl chloride (PVC) and glass. J ApplBacteriol 77: 334-339.
- Legnani P, Leoni E, Rapuano S, Turin D, Valenti C (1999) Survival and growth of Pseudomonas aeruginosa in natural mineral water: a 5-year study. Int J Food Microbiol 53: 153-158.
- Boyle M, Ford T, Maki JS, Mitchell R (1991) Biofilms and the survival of opportunistic pathogens in recycled water. Waste Manag Res 9: 465-470.
- Hunter PR (1993) The microbiology of bottled natural mineral waters. J ApplBacteriol 74: 345-352.
- Jaffe RI, Lane JD, Bates CW(2001) Real-time identification of Pseudomonas aeruginosa direct from clinical samples using a rapid extraction method and polymerase chain reaction (PCR). J Clin Lab Anal 15: 131–137.
- Anzai Y, Kudo Y, Oyaizu H (1997) The phylogeny of the genera Chryseomonas, Flavimonas, and Pseudomonas supports synonymy of these three genera. Int J SystBacteriol 47: 249-251.
- Kiska DL and Gilligan PH(1999) Pseudomonas. In: Murray, Manual of Clinical Microbiology, 7th Edn. American Society for Microbiology Press, Washington DC, pp. 517–525.
- Derek L, Anne G, Etienne ES(2002) Pseudomonas luteola lipase: A new member of the 320-residue Pseudomonas lipase family. Enzyme and Microbial Technology 30:209–215.
- Antonioli P, Lampis S, Chesini I, Vallini G, Rinalducci S, et al. (2007) Stenotrophomonasmaltophilia SeITE02, a new bacterial strain suitable for bioremediation of selenite-contaminated environmental matrices. Appl Environ Microbiol 73: 6854-6863.
- Marty N (1997) Epidemiological typing of Stenotrophomonasmaltophilia. J Hosp Infect 36: 261-266.
- Denton M1, Kerr KG (1998) Microbiological and clinical aspects of infection associated with Stenotrophomonasmaltophilia. ClinMicrobiol Rev 11: 57-80.
- Gerner-Smidt P, Bruun B, Arpi M, Schmidt J (1995) Diversity of nosocomial Xanthomonasmaltophilia (Stenotrophomonasmaltophilia) as determined by ribotyping. Eur J ClinMicrobiol Infect Dis 14: 137-140.
- Rocco F, De Gregorio E, Colonna B, Di Nocera PP (2009) Stenotrophomonasmaltophilia genomes: a start-up comparison. Int J Med Microbiol 299: 535-546.
- Schable B, Villarino ME, Favero MS, Miller JM (1991) Application of multilocus enzyme electrophoresis to epidemiologic investigations of Xanthomonasmaltophilia. Infect Control HospEpidemiol 12: 163-167.
- Yao JDC, Conly JM and Krajden M(1995) Molecular typing of Stenotrophomonas (Xanthomonas) maltophilia by DNA macrorestriction analysis and random amplified polymorphic DNA analysis. J ClinMicrobiol. 33: 2195–2198.
- Denton M, Todd NJ, Kerr KG, Hawkey PM, Littlewood JM (1998) Molecular epidemiology of Stenotrophomonasmaltophilia isolated from clinical specimens from patients with cystic fibrosis and associated environmental samples. J ClinMicrobiol 36: 1953-1958.
- Talon D, Bailly P, Leprat R, Godard C, Deconnink E, et al. (1994) Typing of hospital strains of Xanthomonasmaltophilia by pulsed-field gel electrophoresis. J Hosp Infect 27: 209-217.
- Ketsara F and Benjiamas A(2010) Mixed lipases for efficient enzymatic synthesis of biodiesel from used palm oil and ethanol in a solvent-free system. Catalysis. 67: 52-59.
- Meng L, Jailani S(2011) Conversion of Palm Oil to Methyl and Ethyl Ester using Crude Enzymes. Biotechnology and Biomaterials 1: 1-4.
- Barrow GH and Feltham(1993) Cowan and steel's manual for identification of medical bacteria. Third edition. Cambridge University Press, Cambridge. pp. 331.
- Snehal NA, David MW, Timothy JK, Scott CB, Claire E W, Michael DN, Theo PS (2009) Identification of Pseudomonas aeruginosa by a duplex real-time polymerase chain reaction assay targeting the ecfX and the gyrB genes. DiagnMicrobiol Infect Dis63 :127–131.
- Arnau CM, Francisco L, Anicet RB(2010) Identification of Pseudomonas aeruginosa in water-bottling plants on the basis of procedures included in ISO 16266:2006. J Microbiol Methods. 81: 1-5.
- Sambrook J. and Russel D(2001) Molecular cloning: A laboratory manual 3rd Ed. Cold Spring Harbor Laboratory Press.
- Kiska DL, Kerr A, Jones MC, Caracciolo JA, Eskridge B, et al. (1996) Accuracy of four commercial systems for identification of Burkholderiacepacia and other gram-negative nonfermenting bacilli recovered from patients with cystic fibrosis. J ClinMicrobiol 34: 886-891.
- Qin X, Emerson J, Stapp J, Stapp L, Abe P, et al. (2003) Use of real-time PCR with multiple targets to identify Pseudomonas aeruginosa and other nonfermenting gram-negative bacilli from patients with cystic fibrosis. J ClinMicrobiol 41: 4312-4317.
- VanCouwenberghe CJ, Cohen SH, Tang YJ, Gumerlock PH, Silva J (1995) Genomic fingerprinting of epidemic and endemic strains of Stenotrophomonasmaltophilia (formerly Xanthomonasmaltophilia) by arbitrarily-primed PCR. J ClinMicrobiol; 33: 1289–1291.
- Davin-Regli A, Bollet C, Auffray JP, Saux P, De Micco P (1996) Use of random amplified polymorphic DNA for epidemiological typing of Stenotrophomonasmaltophilia. J Hosp Infect 32: 39-50.
Relevant Topics
- Agricultural biotechnology
- Animal biotechnology
- Applied Biotechnology
- Biocatalysis
- Biofabrication
- Biomaterial implants
- Biomaterial-Based Drug Delivery Systems
- Bioprinting of Tissue Constructs
- Biotechnology applications
- Cardiovascular biomaterials
- CRISPR-Cas9 in Biotechnology
- Nano biotechnology
- Smart Biomaterials
- White/industrial biotechnology
Recommended Journals
Article Tools
Article Usage
- Total views: 17136
- [From(publication date):
December-2014 - Dec 02, 2024] - Breakdown by view type
- HTML page views : 12485
- PDF downloads : 4651
