Heat Waves Affecting Weather and Climate over Albania
Received: 03-Jul-2013 / Accepted Date: 24-Jul-2013 / Published Date: 29-Jul-2013 DOI: 10.4172/2157-7617.1000149
Abstract
Many scientists investigate climate changes and try to predict changes up to several years or decades and the best predictions considerate hindsight analyses and can be assessed on them. Good results are taken for changes on annual mean air temperatures or rainfall meanwhile not enough studies were done about the past and present events of extreme weather. In order to improve the future prediction, a better understanding of extreme weather is needed. It can be done by studying recent events and compare them with similar past events. Generally, extreme weather includes severe or weather at the extremes of their historical distribution. The most used extreme weather definition is based on extreme weather events distribution where extreme events occur at 5% or less of the time. During the last decades, extreme weather often faced Albania and many countries. A less known of extreme weather is the heat wave phenomena and analyses of it were done in this study over two important Albanian cities. As a first step, periods of heat waves were distinguished from the daily temperature records and then analyses of atmospheric patterns associated were done to point out the shapes of air circulation which bring hot and moist air toward Albania. Then, analyses and comparison of atmospheric patterns were done for the days when air temperatures exceed historical records and the results will be used as an attempt for extreme temperature prediction in the short range forecasting
Keywords: Heat wave; Extreme air temperature; Atmospheric pattern
Introduction
As part of Mediterranean area, Albania has a typical Mediterranean climate with soft and wet winters and hot and dry summers. The annual mean of rainfall over Albanian territory stays around 1480 mm/year but the rainfall space distribution shows a high variability from one area to another. The areas with the annual rainfall minimum are located at the southeast of Albania while the abundant rainfall areas during are located on the Albanian Alps, where the annual mean of rainfall reaches up to 3000mm. The precipitations are mainly present during the cold period of October-March (about 70%) with the richest rainfall month of November. In terms of air temperature, annual mean air temperatures range from 7°C in mountain areas up to 15°C in the coast. The annual mean of maximum and minimum temperatures ranges from 11.3°C and -0.1°C in the mountain areas up to 21.8°C and 14.6°C in the coastal and lowland areas. After this normal climate picture, stays the picture of extreme weather events that deviate from the above climatic features. This study is focused on the analysis of daily maximum temperatures during the hot season, which very often have exceeded their normal values compared with daily maximum temperatures of the normal climatic period (1961-1990). Detailed analyses were done for the episodes of several consecutive days where the daily maximum temperature has exceeded with some degrees from the normal maximum temperature. In other words, episodes with high temperatures are studied as a consequence of "heat waves" phenomenon. The aim of this study is to obtain some statistical results about the “heat wave” episodes over Albania and the atmospheric patterns associated to these episodes in order to attempt for the extreme high air temperature prediction.
Material and Methodology
The data used consist on daily maximum air temperatures during the period of 1982-2012 observed for Shkodra and Tirana locations. Also, the monthly mean maximum temperatures for the period of normal climate (1961-1990) are used to estimate the anomaly of daily maximum temperatures observed for the period under the study in order to select the days affected by the “heat wave” phenomenon. The “heat wave” phenomenon is a less known form of severe weather because it is not visible as other forms are like hurricanes, tornadoes, and thunderstorms [1]. The precise criterion for a “heat wave” is determined by the number of consecutive days with high air temperatures, by the rate at which the temperature rises but both of criteria depend on the geographical region and time of year [2]. But there is no universal definition of a “heat wave” because of the variation within temperature values is different geographic locations. In some areas, a heat wave can be an extended period of days with higher than normal temperatures or also a shorter period but with abnormally high temperatures. In the Netherlands, Belgium and Luxembourg a “heat wave” is defined as a period of at least 5 consecutive days with maximum temperatures over than 25°C (recorded in De Bilt town) provided that on at least 3 days within this period, the maximum temperature in De Bilt exceeds 30°C [3]. In Denmark, a “heat wave” is defined as a period of at least 3 consecutive days with average maximum temperature across more than fifty percent of the country, exceeds 28°C while in Sweden, a heat wave is defined as at least 5 days in a row with a daily high exceeding 25°C. In the US, definitions also vary by region to another but however, a “heat wave” is usually defined as a period of at least two or more days of excessively hot weather [4]. In this study, the criterion used for the “heat wave” phenomenon is the one recommended by World Meteorological Organization that says “the phenomenon happens when the daily maximum temperature of more than five consecutive days exceeds by 5°C the average maximum temperature of the normal climate period”. After the “heat wave” affected days are selected, analyses of the air mass circulation are done in order to found details and indices of the phenomena. The air mass analyses are based on the shape of geopotential fields of 500 hPa level because this field shows the origin of air masses flowing toward an area. Many studies are done by different authors who relate the shape of atmospheric patterns of 500 hPa fields with the thermal picture [5,6] examined circulation patterns associated with “heat waves” in Kuwait, changes in regional circulation, specifically related to the northward displacement of the Subtropical Jet Stream and a build up of a ridge of high pressure at the 500 hPa levels, and were determined to be key factors. In addition, study of the temperature series of the Czech Republic from [7], determined that “heat waves” that peaked in the 1940s to early 1950s and early 1990s, were strongly linked to particular synoptic regimes, specifically with a ridge over Europe in the summer season. To point out the shape of atmospheric patterns of each “heat wave” episode, the averaged geopotential fields of 500 hPa level are analysed for each episode. The 500 hPa field are plotted from NCEP/NCAR re-analyses archive, for the domain between 30N-60N and 15W-35E in order to considerate a major part of the western Mediterranean air circulation, as it is responsible for at least 70% of meteorological activity over Albania [8]. The NCEP/NCAR re-analyses are available four times in 24 hours whereas the averaged field of each episode depends on the duration of the heat wave days. Averaged fields are good representatives of each single day air circulation because of some known atmospheric patterns that maintain their shape for many consecutive days [9]. The atmospheric patterns are then classified on southern and south-western origin depending on the orientation of their symmetrical axis regarding to the Albanian territory location.
Results and Discussions
During the period 1982-2012, sixty-one “heat wave” episodes were identified in both Shkodra and Tirana cities that imply a roughly average of 2 episodes per year and 569 days under the “heat wave” conditions during this period (Table 1).
| No. of HW events/month | No. of HW days/month | |||
| Month | Tirana | Shkodra | Tirana | Shkodra |
| May | 5 | 6 | 53 | 49 |
| June | 10 | 12 | 93 | 126 |
| July | 3 | 6 | 25 | 52 |
| August | 6 | 13 | 42 | 129 |
| Total | 24 | 37 | 213 | 356 |
Table 1: Phenomenon of “heat wave” over Albania, during period of 1982 – 2012.
As it can be seen from Table 1 the “heat wave” phenomenon occurs mainly in June and August and consequently, the highest number of “heat wave” days belongs to these months.
For each “heat wave” episode, there are more than five consecutive days with a daily maximum temperature that exceeds by more than 5°C the average maximum temperature of the normal climate period and many of the episodes, counter from 10 up to 15 or 16 days under the “heat wave” conditions. Analyses of the phenomenon distribution during the thirty-one years period show that the second half-period (after the 1996) is the richest period of “heat wave” phenomenon with 74% of the total cases. A fact that shows the phenomenon became more frequent during the two last decades over the Albanian territory (Figure 1).
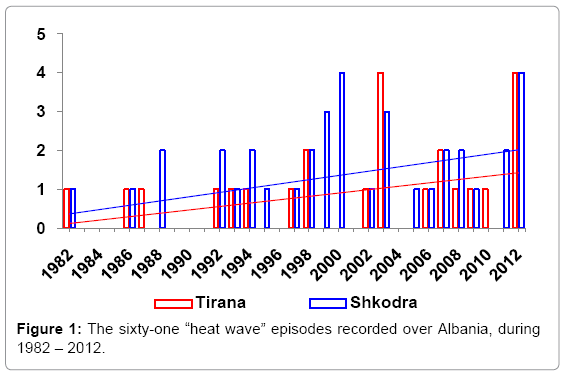
Figure 1: The sixty-one “heat wave” episodes recorded over Albania, during 1982 – 2012.
If we analyse details of the phenomenon distribution for Tirana and Shkodra locations, during the study period, it is a clear the same trend for both of cities, besides the fact that Shkodra in total counters more episodes (37 episodes) than Tirana city (24 episodes).
To define the relationship between the air circulation patterns which bring hot and moist air and the “heat wave” phenomenon over Albania, the averaged geopotential fields of 500 hPa level are analysed for each episode taking into account the duration of the heat wave days. After the analyses, result two types of atmospheric patterns associated with the sixty-one “heat wave” episodes observed over Albania (Figure 2).
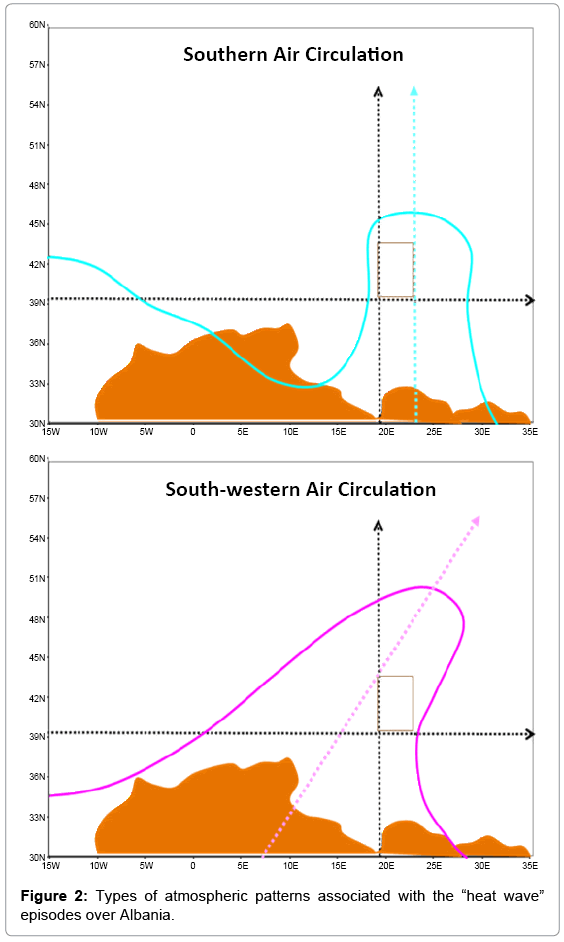
Figure 2: Types of atmospheric patterns associated with the “heat wave” episodes over Albania.
The “heat wave” episodes over Albania, observed for the period of 1982-2012 are driven by the presence of ridges of high pressure at the 500 hPa levels, a specific shape of air circulation that brings stable conditions over the located area. A southern origin air circulation and a south-western were found to be linked to the “heat wave” episodes observed (Table 2).
| Type of Air Circulation | Southern Type | South-western Type |
| Tirana | 33% | 67% |
| Shkodra | 46% | 54% |
| Tirana & Shkodra | 41% | 59% |
Table 2: Types of atmospheric patterns associated with the sixty-one “heat wave” episodes.
Following the Table 2, during the days of “heat wave” over Tirana, the most part of episodes are driven by a south-western shape of the air circulation (67% of the total episodes). It means that the impact of a south-western pattern on daily maximum air temperatures for Tirana is clearly bigger than the impact of a southern pattern because the air masses trajectory over ground surfaces is larger than over sea surfaces. Air masses flowing over sea surfaces take water vapour that may increase the air humidity and consequently may decrease the air temperatures. Meanwhile for Shkodra, the type of atmospheric patterns associated to the “heat wave” episodes play more or less the same role. A fact that can be explained by the Shkodra position more in the north that leaves the city in many cases on the periphery of the “heat wave”, especially “heat wave” driven by south-western atmospheric patterns. Looking for a relation of atmospheric pattern type and the number of days under the “heat wave” conditions, results that majority of days with extreme high air temperatures belongs to the south-western type of air circulation for both Tirana and Shkodra (Table 3).
| Type of Air Circulation | Southern Type | South-western Type |
| Tirana (213 days) | 28% | 72% |
| Shkodra (356 days) | 43% | 57% |
| Tirana & Shkodra (569 days) | 37% | 63% |
Table 3: Number of days under “heat wave” condition in relation to the type of air circulation.
Going deeper into the analyses of atmospheric patterns associated with the “heat wave” phenomenon results that extreme values of air temperatures for both Tirana and Shkodra location (respectively on 24 July of 2007, 41.6°C and on 7 August 2012, 42.4°C) are observed when there is a presence of a south-western air circulation pattern (Figure 1). The above extreme high temperatures became the historical records for both of the cities because they exceeded the former record of 41.5°C (on 18 July of 1973 recorded for Tirana and on 3 August of 1981 recorded for Shkodra).
Comparing the difference between the daily maximum temperature during the phenomenon and the respective average maximum temperature of the normal climate period, results that Tirana city registered on 25 June of 2007, a daily maximum air temperature of 39.9°C that is 12.6°C over the average maximum temperature of the normal climate period. Meanwhile Shkodra city registered on 7 August of 2012, a daily maximum air temperature of 42.4°C that is 12.4°C over the average maximum temperature of the normal climate period. The difference on maximum air temperatures for both cities is clearly very high, more than twice of the difference needed to consider the episode as a “heat wave” phenomenon. As a consequence, the south-western air circulation can be considered as an atmospheric pattern that brings extreme high air temperatures over Tirana and Shkodra.
Conclusions
During a thirty-one years period, sixty-one “heat wave” episodes were identified in both Shkodra and Tirana cities, around 2 episodes per year that counter 569 days under the “heat wave” conditions. The “heat wave” distribution shows that “heat wave” phenomenon became more frequent during the last two decades, with 74% of the total episodes, recorded after the year 1996. The “heat wave” episodes over Albania are driven by a southern and a south-western shape of the air circulation. The most part of the “heat wave” episodes and the highest number of days under the “heat wave” conditions over Tirana and Shkodra are associated with a south-western type of atmospheric pattern. Extremely high air temperatures, exceeding the historical records for both Tirana and Shkodra are reached when there is a “heat wave” driven by a south-western air circulation pattern. The presence of a south-western air circulation shape can be related to the extreme high air temperatures and may be used as a tool to improve the forecasting of extremely high air temperatures.
References
- Sheridan S (2002) The redevelopment of a weather type classification scheme for North America. Int J Climatology 22: 51-68.
- Robinson PJ (2001) On the definition of heat waves. J App Meteor 40: 762-775.
- Huynen M, Martens P, Schram D, Weijenberg MP, Kunst AE (2001) The impact of heat waves and cold spells on mortality rates in the Dutch population. Environ Health Perspect 109: 463-470.
- Frich P, Alexander LV, Della-Marta P, Gleason B, Haylock, M, et al. (2002) Observed coherent changes in climatic extremes during the second half of the twentieth century. Clim Res19: 193-212.
- Garcia R, Prieto L, Diaz J, Hernandez E, Del Teso T, et al. (2002) Synoptic conditions leading to extremely high temperatures in Madrid. Annales Geophys 20: 237-245.
- Nasrallah HA, Nieplova E, Ramadan E (2004) Warm season extreme temperature events in Kuwait. J Arid Environ 56: 357-371.
- Kysely J (2003) Temporal fluctuations in heat waves at Prague-Klementinum, the Czech Republic, from 1901–97, and their relationships to atmospheric circulation. Int J Climatol 22: 33-50.
- Porja T, Mustaqi V (2011) Atmospheric Patterns and Predicting Heavy Rainfall in Albania. Albanian J Natural & Tech Sci 30: 23.
- Kalnay E, Kanamitsu M, Kistler R, Collins W, Deaven D, et al. (1996) The NCEPNCAR 40-year Reanalysis project. B Am Meteorol Soc 437-471.
Citation: Porja T (2013) Heat Waves Affecting Weather and Climate over Albania. J Earth Sci Clim Change 4: 149. Doi: 10.4172/2157-7617.1000149
Copyright: ©2013 Porja T. This is an open-access article distributed under the terms of the Creative Commons Attribution License, which permits unrestricted use, distribution, and reproduction in any medium, provided the original author and source are credited.
Share This Article
Open Access Journals
Article Tools
Article Usage
- Total views: 16428
- [From(publication date): 8-2013 - Apr 27, 2024]
- Breakdown by view type
- HTML page views: 11867
- PDF downloads: 4561