Detection and Visualisations of Ecotones–Important Landscape Pattern under Uncertainty
Received: 25-Jul-2013 / Accepted Date: 27-Jul-2013 / Published Date: 02-Aug-2013 DOI: 10.4172/2157-7617.1000e108
Ecotones are significant part of almost every landscape structures and have a significant effect on the distribution of species. Spatial variability of ecotones has resulted in problematic modelling, analysis and visualization of these landscape forms. Their spatial variability and fuzzy character are causing uncertain and problematic handling in GIScience. Uncertainty of ecotones in the landscape arises from many sources, including complexities inherent in ecosystems and their disturbance processes. However, gaining knowledge about ecosystems at the landscape level is often impeded by limitations in collecting comprehensive, representative, as well as accurate data sets. The investigation into ecotones enables a better understanding of the causal relationships between certain landscape elements and landscape utilization categories. Visualization of spatial uncertainty is still challenging topic for cartographic community with many unsolved research questions. The presentation explores the possible visualization methods for portrayal ecotones based on detection, description and analysis of geographic boundaries of Trkmanka river catchment with respect to cartographical rules and cognitive aspects. Ecotones plays
Ecotones
Ecotones are significant regions of landscape heterogeneity that contain elements, patterns, and processes existing and operating at varying spatial scales [1]. Ecotones play a pivotal role in landscape. This can be seen from several viewpoints environmental, biological, economic, historic, aesthetic, etc. Their most crucial task is ecological. Spatial relationships within the surrounding environments are of great importance since ecotones are the zones where communities, populations of plants and animals meet, where they compete, create some tension and blend. In nature ecotones often function as corridors or barriers enabling or restricting the flow of mass or energy. Ecotones represent specific ecosystems in a landscape, corridors for the migration of animals or distribution of plants. They also contribute to soil protection against erosion, etc. During their existence ecotones go through developmental stages which depend primarily on the dynamics of factors in the surrounding environments. Some ecotones are temporally stable some may migrate or mutate. Spatial relationships within the surrounding environments are of great importance since ecotones are the zones where communities, populations of plants and animals meet, where they compete, create some tension and blend. In nature ecotones often function as corridors or barriers enabling or restricting the flow of mass or energy. The temporal and spatial stability of ecotones contributes to the ecological value of the ecotone community and to the greater value of a landscape. We can classify ecotones by various aspects, e.g. by structure. It is difficult to perfectly simulate the real world, due to its complexity. Ecotones capture the nutrients, especially nitrogen, chemicals, pesticides, leached and brought in from surrounding areas. Complement can be even function as the supporting element of landscape structure, which reinforces the structure and landscape heterogeneity. The occurrence of ecotones also corresponds to the intensity of land use, and also reflects the current state, the indicator of environmental changes, because ecotones are colonized by specific range of plant species that represent areas very sensitive to environmental changes. Therefore, its monitoring can be an important tool for detection of various processes, for example the immediate community response to climate change induced due to the increase in the concentration of carbon dioxide in the atmosphere. In the current cultural landscape ecotones also have a stabilizing function in a mosaic of cultivated ecosystems.
Uncertainty
For a complex understanding, modelling and subsequent visualization, sufficient information, data and especially perfect comprehension of all natural processes and components are almost always missing. Subsequent modelling and visualization of these processes are, therefore, not possible without a certain degree of approximation. Within natural processes and environmental studies, there still exist components that are unknown or may not be recognizable with sufficient accuracy. There are still errors generated during gathering of data (measuring devices, sensors), data treatment and processing (data mining) and, consequently, also by visual data representations. It can, therefore, be said that almost all studies dealing with natural components include some degree of uncertainty. The problem arises when the results of these analyses become the subject of interest of other professionals who use the visualizations and analyses as basis for supporting their decisions. Then it is necessary to communicate the information desired by such experts in a form that is as accurate as possible. It has been argued that uncertainty information is a vital component in the use of spatial data for decision support [2]. Many techniques have been developed for communicating uncertainty in data and models for specific visualization applications.
Uncertainty Visualisations
Understanding the quality of geospatial data is fundamental to using it intelligently. A systematic approach to data quality requires: estimating and describing the quality of data as it is collected; recording the data quality as metadata; propagating uncertainty through models for data processing; exploiting uncertainty appropriately in decision support tools; and communicating to the user the uncertainty in the final product [3]. Visualization of uncertainty in GIS products is essential to communicate uncertainties to decision makers. This helps to prevent decision makers from being blinded by the quality of the display, and to make them aware of the underlying uncertainty of the product. The representation of uncertainty has significant coverage within the literature and visual methods such as colour, blurring or multiple maps are generally effective (Figure 1) [4,5]. However these methods can obscure underlying data or limit the amount of information shown.

Figure 1: Possible visualisation methods for uncertainty visualisations.
Spatial data uncertainty can be classified according to its kind into positional uncertainty, attribute uncertainty, time uncertainty, incompleteness and logical inconsistence [6]. Uncertainties and errors are inextricably linked with geodata and may have implications for data analysis and modelling [7]. Errors may occur at various stages, starting with space observation and ending with its presentation in GIS. Analyses of geodata quality have led to creating the set of geodata quality elements [8]. Initial efforts were developed with the purpose of defining the "data quality" categories which should be encoded as part of metadata of cartographic data. Single categories defined as part of spatial data transfer standard are listed and explained below. This metadata of quality spatial data can be used to express certain aspects of the uncertainty with regard to this data but they do not carry any information on how to present such metadata visually.
Area of Interest
The area of interest is the Trkmanka River basin which is a left tributary of the Dyje River. The area is located in South-east Moravia and stretches over approximately 380 m2. Trkmanka springs at 300 m above sea in the Ždánický forest north-west of the Ždánice village. The river is of lowland characteristics, it flows through an open countryside, meandering slightly at first while it runs straight through the regulated riverbed from Dražuvky onward. Concerning the vegetation cover, the area is covered with 72 % agricultural area, 18 % forests and 10 % vegetation-free area. Subxerophilic oak woods contain communities which are typical for the warmest parts of Bohemia and Moravia. The prevailing species of the forest floor are the Sessile oak, the English oak and the hornbeam. A highly developed shrub floor is a characteristic feature.
Methodology
Main aim of visualizing the uncertainty in the landscape was to find, measure and predicts the accuracy of the acquired land use classes at every location in the modelled area. To achieve this, we subdivide the whole model space into a regular raster with equal cell sizes and calculate the Shannon’s Index.
The development of the idea of entropy of random variables and processes by Claude Shannon provided the beginnings of information theory and of the modern age of ergodic theory [9]. The information entropy H is defined as the sum of all products of probabilities p for each possible outcome i of N total possible outcomes with its logarithm. Shannon’s Index H is a measure of diversity and evenness that reflects both the number and the balance of unique values within an area (in this case, the area is a moving window). H values increase with both the number of classes observed and with how evenly distributed they are. There are alternative methods for calculating this index and we used tool Land Facet Corridor Designer [10].
Based on calculated entropy for each pixel we wanted to find and distinguish each of the raster cells based on measuring of uncertainty fulfilling the following criteria and schema:
1. The value should be 0 when no uncertainty exists, i.e. there is only one possible outcome (i.e. land use of pixel is forest).
2. The value should be maximal when all n possible outcomes are equally likely. In this cell there is very small chance to find exactly desired land use.
3. If more outcomes are equally likely, the measure should have a higher value (“monotonicity”).
Results
The example shows that information entropy can be used to visualize uncertainties in the landscape structures. Additionally, it gives an explanation where uncertainties (transition zones as ecotones) may occur. The example also shows further that, beyond pure visualization, the measure can be interpreted in a quantitative way [11]. We can clearly distinguish areas with high uncertainty from results (Figures 2 and 3). These areas highly correspond with actual presence of ecotones (transitions zones) in the landscape proved by field survey. The visualisation of ecotones can help to decision-makers and stakeholder to make better decision concerning their land and management. This can help cope with erosion and other problem in the landscape.
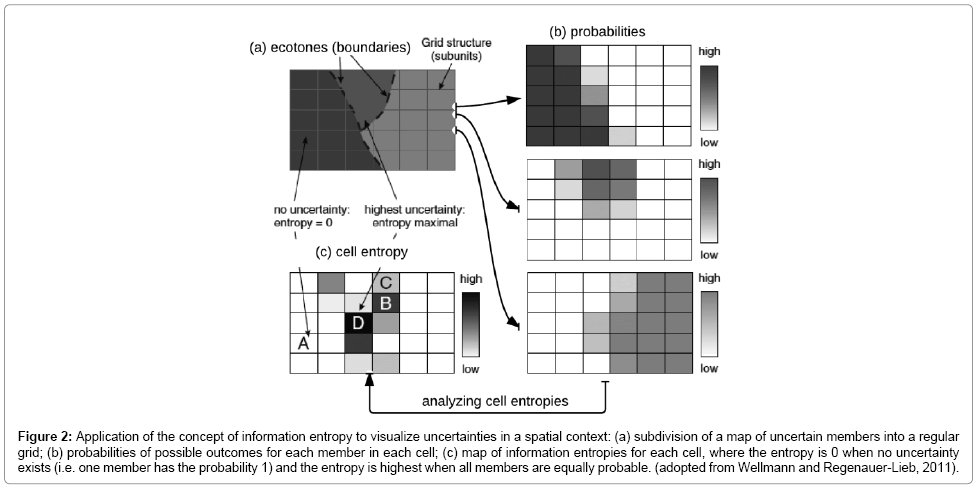
Figure 2: Application of the concept of information entropy to visualize uncertainties in a spatial context: (a) subdivision of a map of uncertain members into a regular grid; (b) probabilities of possible outcomes for each member in each cell; (c) map of information entropies for each cell, where the entropy is 0 when no uncertainty exists (i.e. one member has the probability 1) and the entropy is highest when all members are equally probable. (adopted from Wellmann and Regenauer-Lieb, 2011).
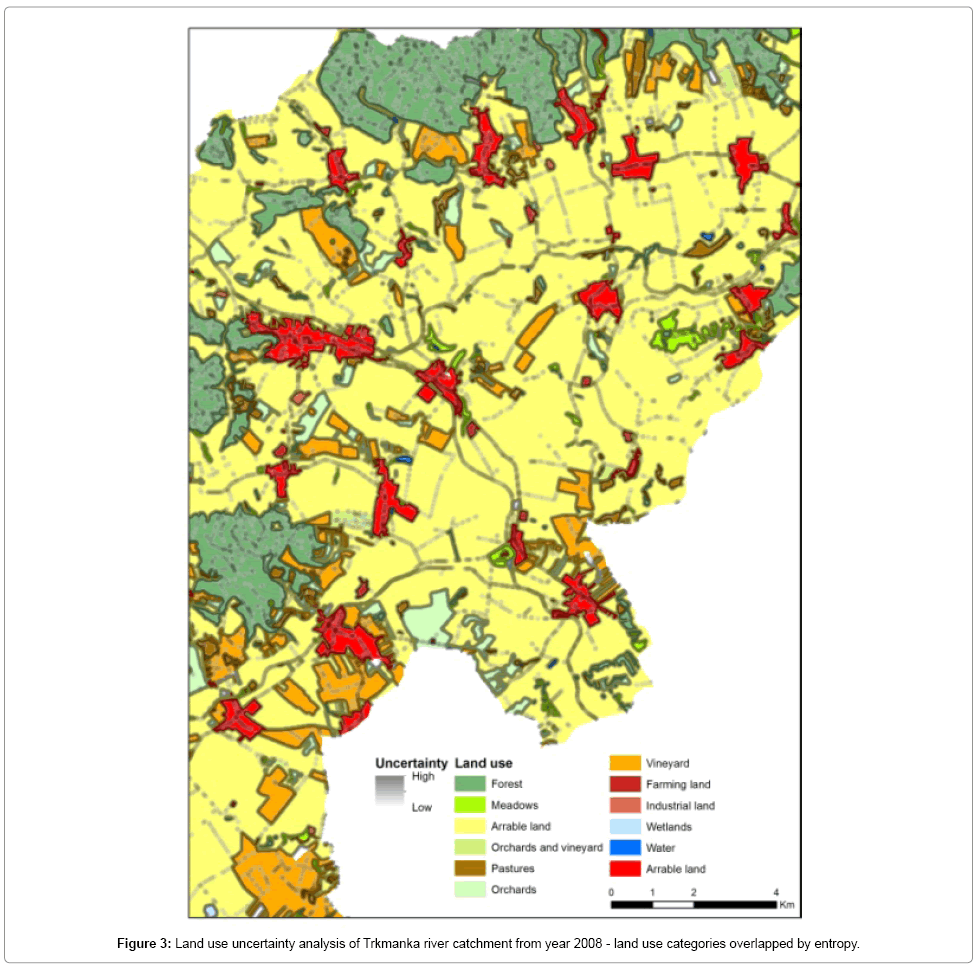
Figure 3: Land use uncertainty analysis of Trkmanka river catchment from year 2008 - land use categories overlapped by entropy.
References
- Nellis MD, Briggs JM (1989) The effect of spatial scale on Konza landscape classification using textural analysis. Landscape Ecology 2: 93-100.
- Jankowski P, Nyerges T (2001) Geographic Information Systems for Group Decision Making, Taylor & Francis, London, UK.
- Laskey KB, Wright EJ, Costa P (2010) Envisioning uncertainty in geospatial information. Int J Approx Reasoning 51: 209-223.
- Appleton K, Laveet A, Docketry T, Berg GS (2004) Representing Uncertainty in Visualisations of Future Landscapes. In: Proceedings of the XXth ISPRS Congress.
- Ehlschlaeger CR, Shortridge AM, Goodchild MF (1997) Visualizing spatial data uncertainty using animation. Comput & Geosci 23: 387-396.
- Shi W (2010) Principles of modeling uncertainties in spatial data and analyses. CRC Press/Taylor & Francis.
- Burrough PA, Mcdonnel R (1998) Principles of geographical information systems. Edtion ed. Oxford: Clarendon Pressm, UK.
- Guptill SC, Morrison J (1995) Elements of spatial data quality. Elsevier Science 202.
- Jenness JB, Brost, Beier P (2011) Land Facet Corridor Designer: Extension for ArcGIS. Jenness Enterprises.
- Wellmann JF, Regenauer-Lieb K (2011) Uncertainties have a meaning: Information entropy as a quality measure for 3-D geological models. Tectonophysics.
Citation: Brus J, Boori MS, Vozenilek V (2013) Detection and Visualisations of Ecotones–Important Landscape Pattern under Uncertainty. J Earth Sci Clim Change 4: e108. Doi: 10.4172/2157-7617.1000e108
Copyright: ©2013 Brus J, et al. This is an open-access article distributed under the terms of the Creative Commons Attribution License, which permits unrestricted use, distribution, and reproduction in any medium, provided the original author and source are credited.
Share This Article
Open Access Journals
Article Tools
Article Usage
- Total views: 14516
- [From(publication date): 7-2013 - Apr 19, 2024]
- Breakdown by view type
- HTML page views: 10031
- PDF downloads: 4485