Conceptual and Numerical Model Development for Groundwater Resources Management in a Regolith-Fractured-Basement Aquifer System
Received: 05-Sep-2013 / Accepted Date: 13-Sep-2013 / Published Date: 21-Sep-2013 DOI: 10.4172/2157-7617.1000156
Abstract
Groundwater resources in crystalline rock are typically associated with the weathered and fractured zones that are well connected to the surface. However, these zones are highly-productive aquifers. In this paper, numerical simulations of a conceptual hydrogeological model show that the flow to such strongly transmissive fractured zones is controlled by their Transmissivity or by their structure. While leakage through the regolith unit is generally the major factor of recharge that sometimes occurs at least close to the outcrop of the fractured zone where the overlying rock is thinner and guarantees the availability of some groundwater. This is precisely the case of the Pallisa aquifer (eastern Uganda) located in a crystalline rock geologic setting, where groundwater in a shallowly fractured zone is used as the source of water supply for the rural poor. Even though the model was constructed as a simplified conceptual model, it constitutes the first attempt to simulate the entire Pallisa aquifer. The hypothesis of a continuous porous medium unit was sustainable as a first approximation to construct a numerical Model muse model covering the full extent of the aquifer. The model was calibrated for a steady-state condition. Simulation results show that the weathered and fractured zones represent potential aquifers under a large variety of hydrogeological conditions. The leakage through the regolith to the basement complex fractured rock unit enhances water availability.
Keywords: Modeling; Fractured-basement-aquifer; Pallisa district; Hydrogeology; Model muse
Introduction
Climate variability is one of the major challenges facing mankind in the world. Africa experiences various environmental problems such as drought and floods and these have increased over the years in intensity and frequency due to climate variability and change. The poor in Uganda greatly depend on natural resources to cope with extreme climatic changes such as drought and floods. Many researchers and different scientists define a change of climate and variability as an attribute directly or indirectly brought about by human activity that alter the composition or conditions of the global atmosphere and which is in addition affect the groundwater sources. Groundwater exploration has always demanded costly data collection. As an alternative, the use of models has proved to be a cost effective approach that allows understanding and predict the future behaviour of complex hydrogeological systems.
Despite groundwater’s significance, there has been comparatively little research on groundwater particularly in the context of climate variability and change impact assessment [1]. This paper therefore describes the main approaches used for modelling groundwater flow in weathered and fractured bedrock aquifers. Further, this paper gives an insight about the response of the Pallisa groundwater flow system to different possible occurring scenarios like decreased recharge and increased groundwater abstraction under climate variability. A number of approaches exist, but most, the equivalent porous media approach is used in this study. In the equivalent porous media approach, hydraulic properties of the system are modelled using equivalent coefficients such as permeability and effective porosity to represent the volume averaged behaviour of many fractures within a fractured rock body. In addition, boreholes usually give important complementary information for the interpolation of the fracture network and its attributes into depth. Furthermore the results of the fracture network analysis are compared with the results of the hydraulic attributes related to the fracture set volumes. The combination of all these data help in generating the calculated hydraulic attributes of fracture networks for numerical hydraulic modelling of granitised fractured aquifer. So, this model may be used as a tool to water resource managers to assess the regional affects of change in stresses to the steady-state system. In here, improvement and understanding of the groundwater flow system is very important as indicated by the pumped boreholes in Figure 1. The conceptual model of the study area in Figure 2 describes the recharge and discharge in the aquifer systems.
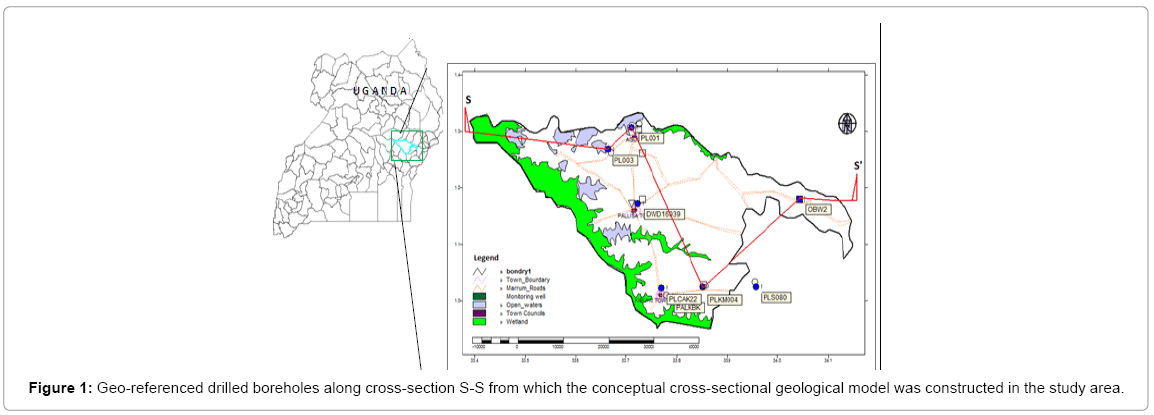
Figure 1: Geo-referenced drilled boreholes along cross-section S-S from which the conceptual cross-sectional geological model was constructed in the study area.
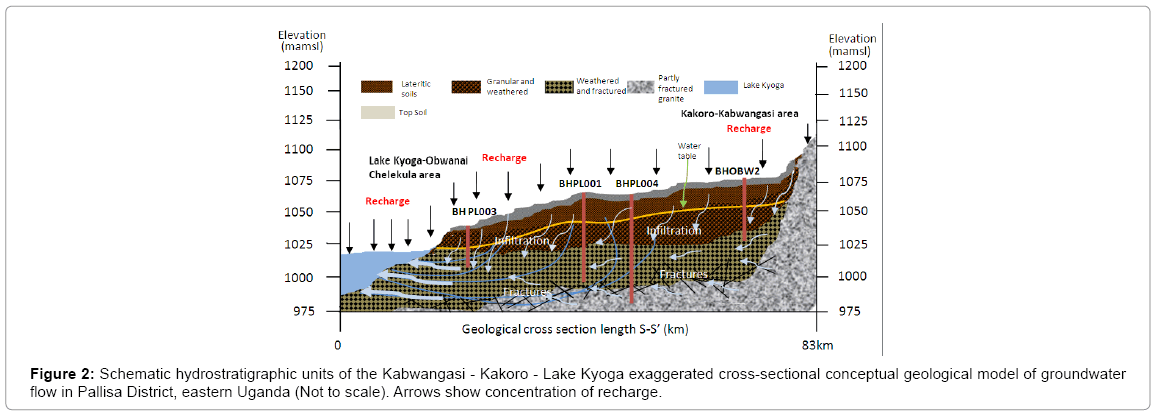
Figure 2: Schematic hydrostratigraphic units of the Kabwangasi - Kakoro - Lake Kyoga exaggerated cross-sectional conceptual geological model of groundwater flow in Pallisa District, eastern Uganda (Not to scale). Arrows show concentration of recharge.
Objectives
The general objective of this study is to understand, develop and construct a numerical flow model as a groundwater management tool through subsurface flow simulation for fractured aquifers in different catchments/zones of Uganda. The need to understand the regional groundwater flow system of Pallisa District is mainly driven by these two factors:
1. It is a known fact that there is uncertainty on the amount and distribution of rainfall patterns resulting in drought and famine in the region; hence the need to devise methods of supplementing the rain fed agriculture in the near future.
2. Modernisation of agriculture as a nom today in Uganda and with the upscale in industrial and population growth, increase of pollutants as an input to groundwater cannot be avoided and hence understanding the groundwater flow system is crucial in protecting the fractured aquifers from pollution and here groundwater modelling becomes the most available tool to do so.
Specific objectives
In order to solve the above two reasons the following specific objectives are to be considered:
1. To conceptually model it and delineate the condition of the study area from DEM using Model Muse.
2. To describe and develop a groundwater flow model using MODFLOW characteristics within the context of Pallisa District fractured aquifer.
3. To use recharge as an input of the groundwater system in MODFLOW and describe the simulated effects to future groundwater levels.
The scope of the study is limited to Pallisa fractured aquifer system located in Kyoga basin, eastern Uganda.
Materials and Methods
Materials
Fractures have been recognized as significant groundwater bearing features and quite problematic for the last 30 years world-wide used the MODFLOW porous media model to determine watershed-scale aquifer parameters in a fractured sedimentary aquifer system in eastcentral Pennsylvania [2]. Lebbe [3] on the other hand used a synthetic pumping test for the validation of their two-aquifers-mlu numerical model. The MLU Multi-Layer Modelling Approach was used to build fully three-dimensional (3D) models of transient well flow. It was based on an analytical solution for transient well flow in layered aquifer systems. Moench [4] developed an analytical solution for flow to a partially penetrating, finite diameter well in a homogeneous, vertically anisotropic water table aquifer and the simulated data were used to estimate the hydraulic properties. Previous work in Africa on hydrogeology and water supply have been widely investigated and discussed [5,6] and various techniques have been developed to locate favourable sites for the exploitation of groundwater resources within the basement fractured rocks. Ayenew [7] did conduct a 3D steady-state finite-difference groundwater flow model study from 131 wells in the Akaki catchment of central Ethiopia for potable water supply to the city of Addis Ababa. The simulation was conducted in a two layer unconfined aquifer with spatially varying recharge and hydraulic conductivities and specific defined boundary condition. The result indicated a groundwater flow south direction towards the major production well field. Theoretical studies of a two dimensional groundwater flow in vertical section [8] indicated that local, intermediate and regional flow systems could be superimposed on one another within a groundwater basin which was a contrast to the general behaviour of crystalline aquifers which suggest that groundwater flow is essentially shallow, focused in the weathered and fractured zone and generally limited to 50 m below ground level. Howard [9] asserts that excessive exploitation of the basement aquifer would induce vertical leakage from the regolith in a situation of good hydraulic interconnection between the basement and the regolith. However, recharge to the bedrock from the overlying regolith is generally difficult to estimate as it is governed by the hydraulic conditions at the regolith-bedrock interface. Very few published studies address the issue of recharge from the regolith to bedrock, but Rodhe [10] showed that granitic bedrock aquifer was recharged by vertical flow from the overlying 10 m thick till soil and based their assumption that the bedrock can be represented as a continuous porous aquifer. In northern, central and western Ugandan hydrogeology has been carried out by [11-15]. Detailed structural geological studies covering the whole of the eastern region are missing. Some early studies [16-18] concentrated on the description of and provision of lithological and tectonic evidence of the deeply weathered mantle in Uganda. According to Nyende [19] the potential of groundwater in Pallisa was estimated to be 215.2 Mm3/year. This study also indicated a high replenishment capacity as a result of the high intensity rainfall and the recharge rate estimated at 110 mm/year in the region, which increased between 200-225 mm/year in 2007, but this has been witnessed by the gradual decline in groundwater level. This may be attributed to seasonal variations impacted by climate variability and change.
Methods
Concepts and models in hydrogeology: Groundwater management is mainly based on proper characterisation of hydrogeological parameters. In this study, the different methods, approaches and concepts in hydro geological modelling for fractured aquifers were reviewed [20]. The EPM approach was incorporated into the modelling process as discussed in the flow chart, (Figure 3) below that fully describes the methodology used.
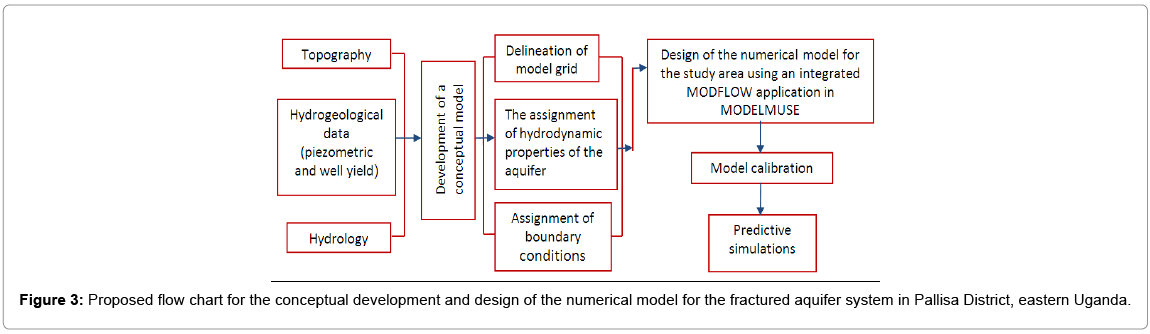
Figure 3: Proposed flow chart for the conceptual development and design of the numerical model for the fractured aquifer system in Pallisa District, eastern Uganda.
The Equivalent Porous Medium (EPM) approach: In this approach, individual fractures are not explicitly treated in the model but rather the heterogeneity of the fractured rock system is modelled using a small number of regions, each of which was modelled as an equivalent porous medium (Figure 4). The conceptual model developed was based on the data from geological and hydrogeological studies by [19,21-23]. However, due to the complexity of processes occurring in the natural system, hydraulic models for far-field problems are not generally composed of individual fractures. For such cases, the equivalent porous medium (EPM) approach is widely used [24]. This conceptual model implies that fluid flow is similar to that through porous media having equivalent hydraulic properties as a given network with fractures explicitly represented.
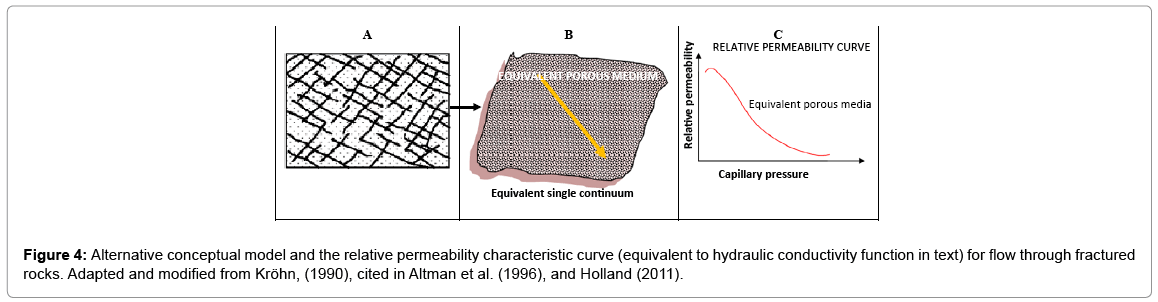
Figure 4: Alternative conceptual model and the relative permeability characteristic curve (equivalent to hydraulic conductivity function in text) for flow through fractured rocks. Adapted and modified from Kröhn, (1990), cited in Altman et al. (1996), and Holland (2011).
The evaluation of equivalent hydraulic properties generally assumes the concept of the Representative Elementary Volume (REV) [25]. One particular issue of concern is the evaluation of the REV in fractured rock masses is the fact that fluid flow in fractured rock masses is highly scale-dependent [26,27]. Although there are many studies showing the important role of fractures on fluid flow, only few detailed studies consider the complexity and heterogeneity of fracture systems in Pallisa [28,29].
The Arc View and Arc GIS 2009 tools: Arc View v3.2a and Arc GIS v9.3 were used for visualising, managing, creating and analysing geographical data. They were also used to perform GIS tasks ranging from simple to complex. The tasks included mapping, geographic analysis, data editing and compilation, data management, visualisation and geo-processing. In Arc Map geographic information is represented as a collection of layers and other elements in a map view.
Development of groundwater flow model: This section describes the concept of groundwater flow modelling and development of groundwater model. The development of the conceptual this model is based upon available field measured parameters (Table 1).
| Features | Description | Comment |
|---|---|---|
| Boundaries | Location and type of boundaries for an area to be modelled (topography) | Boundary types include specified flow, specified head, and head-dependent flow etc. |
| Geological framework | Geological units and corresponding hydrostratigraphic units and model layers and associated aquifer parameters. Bedrock configuration and aquifer or aquitard characteristics | Hydrostratigrahic units comprise geological units with similar aquifer properties. a geological formation may be subdivided into aquifer and confining units ( or several layers) |
| Hydrological framework and stresses | Rate of recharge, extent of recharge area and discharge processes and dominant aquifer flow mechanisms | Definition of aquifer media type (porous medium and fractured rock), and surface groundwater interaction processes (aquifer characteristics) |
| Human induced factors | Anthropogenic influence on the system | Pumping, drainage, etc |
| Groundwater Balance | ||
Table 1: Data considered in conceptualisation and development of groundwater model.
The conceptualization of the hydrostratigraphy and groundwater flow is generally well presented in this Case Study. However, the results are prefaced by the extremely limited dataset on which model conceptualization and calibration were based. Furthermore, major assumptions of equivalent porous medium for fractured bedrock, horizontal isotropy of hydraulic conductivity of the various fractured bedrock units and effective porosities did not appear to be justified by data or assessments from the site.
Conceptualisation of the model
Grid construction and layer discretisation: The groundwater developed for the study area was discretised with a finite-difference grid that composed of 200 rows and 373 columns with uniform cell dimensions of 250 m by 250 m (Figures 5-11) re-sampled from a 90-m resolution covered approximately 1 585.2 km2 in area . The larger grid cell of 250-m resolution results in more simplification of the conceptual model. There are a total of 74, 600 cells in the model domains of which 32, 379 are active cells and 42, 221 are inactive cells in both layers. The model domain was divided into two major layers corresponding to the main geological surfaces: Layer 1 and Layer 2.
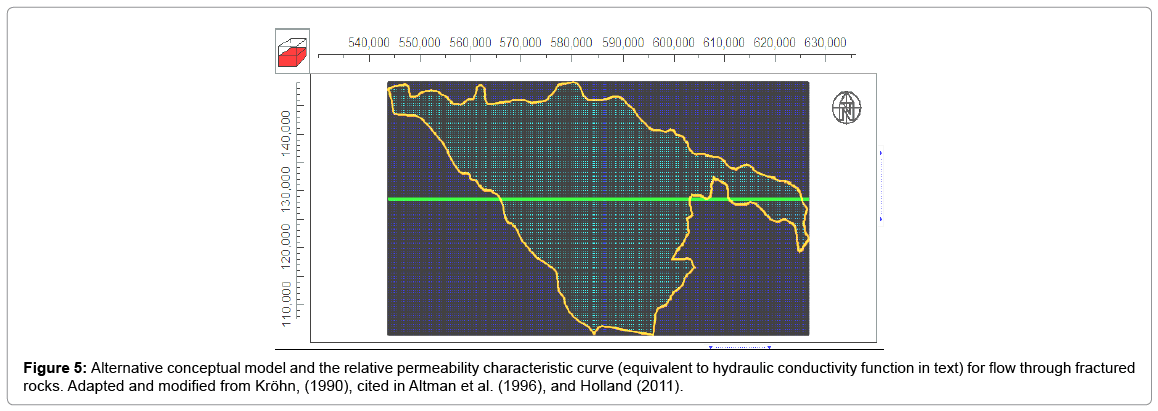
Figure 5: Alternative conceptual model and the relative permeability characteristic curve (equivalent to hydraulic conductivity function in text) for flow through fractured rocks. Adapted and modified from Kröhn, (1990), cited in Altman et al. (1996), and Holland (2011).
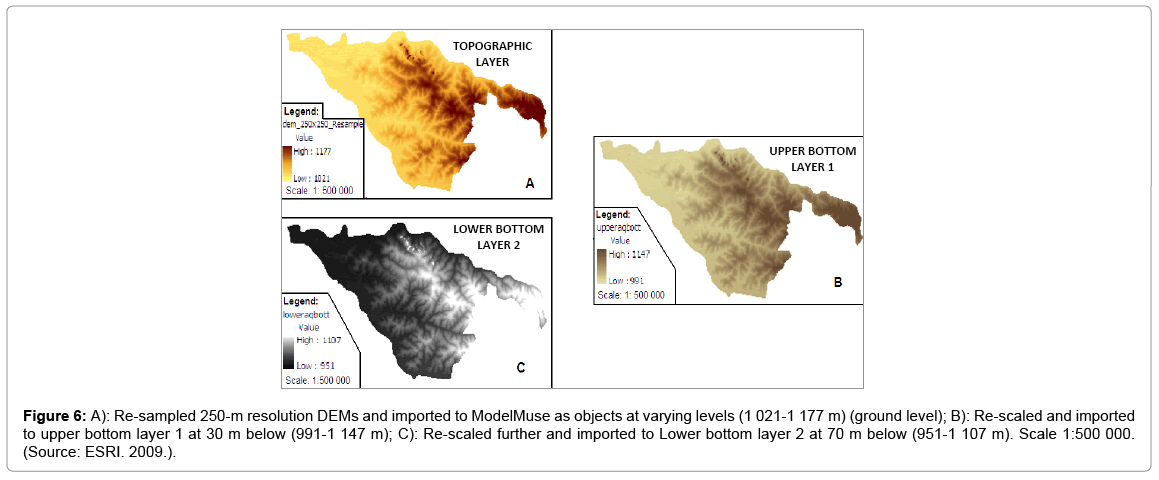
Figure 6: A): Re-sampled 250-m resolution DEMs and imported to ModelMuse as objects at varying levels (1 021-1 177 m) (ground level); B): Re-scaled and imported to upper bottom layer 1 at 30 m below (991-1 147 m); C): Re-scaled further and imported to Lower bottom layer 2 at 70 m below (951-1 107 m). Scale 1:500 000. (Source: ESRI. 2009.).
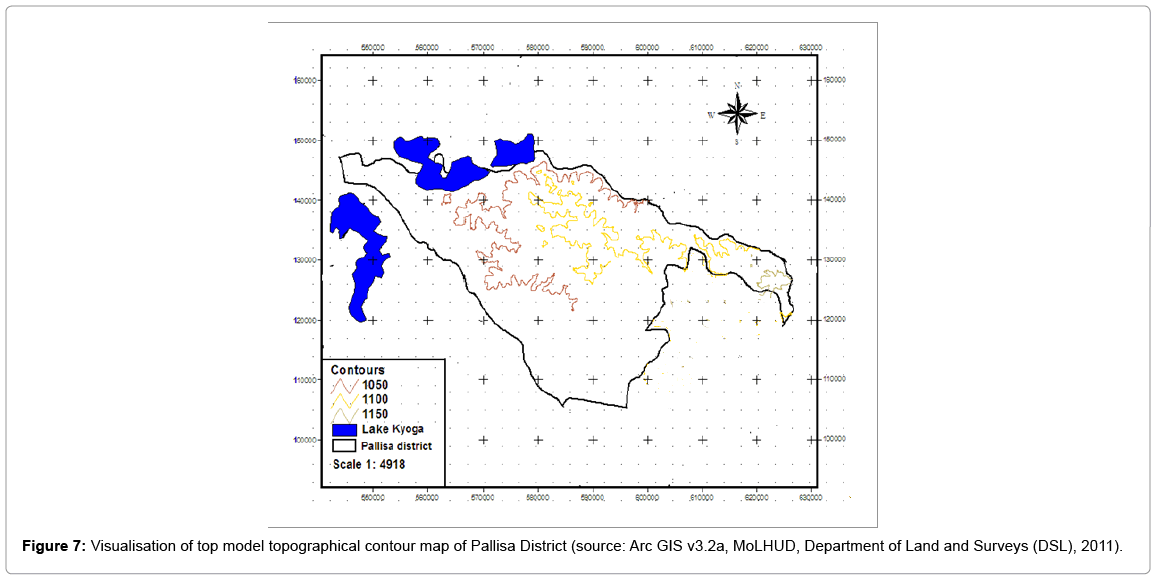
Figure 7: Visualisation of top model topographical contour map of Pallisa District (source: Arc GIS v3.2a, MoLHUD, Department of Land and Surveys (DSL), 2011).
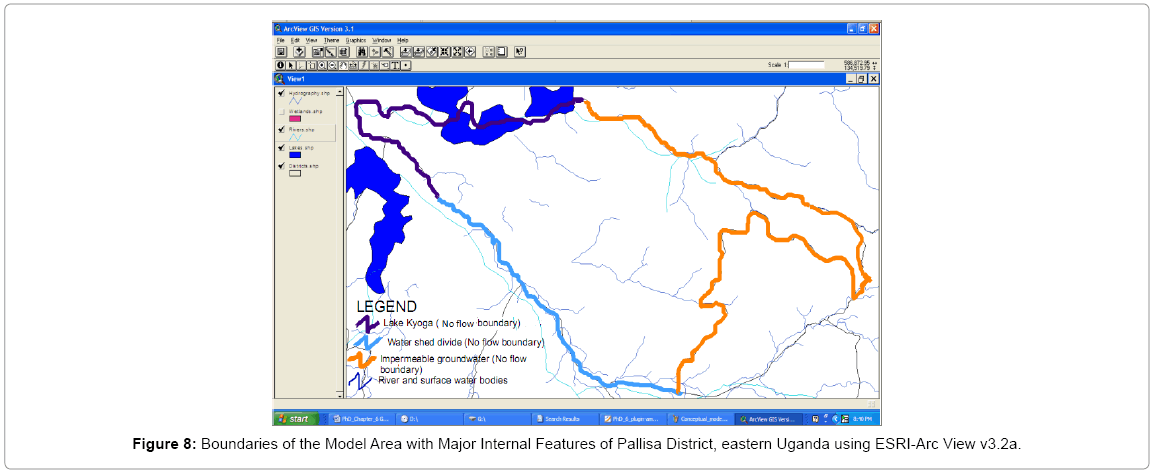
Figure 8: Boundaries of the Model Area with Major Internal Features of Pallisa District, eastern Uganda using ESRI-Arc View v3.2a.
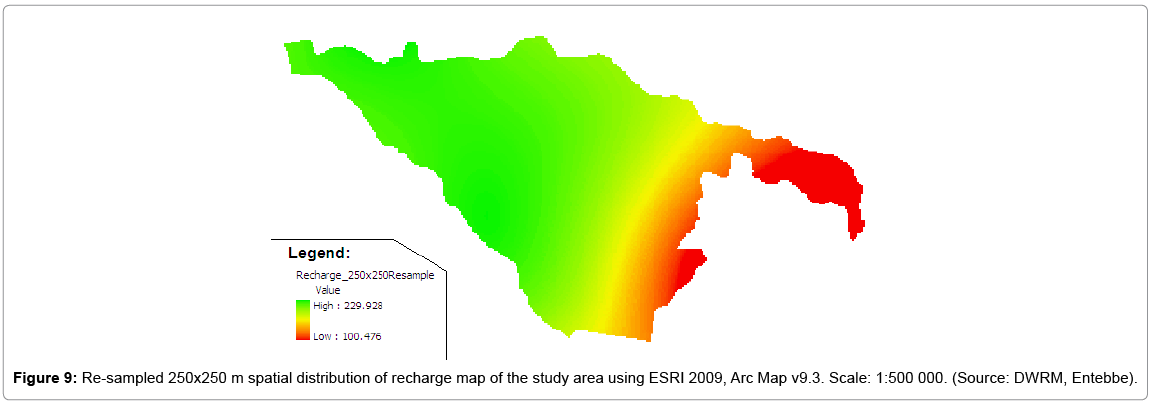
Figure 9: Re-sampled 250x250 m spatial distribution of recharge map of the study area using ESRI 2009, Arc Map v9.3. Scale: 1:500 000. (Source: DWRM, Entebbe). TOP
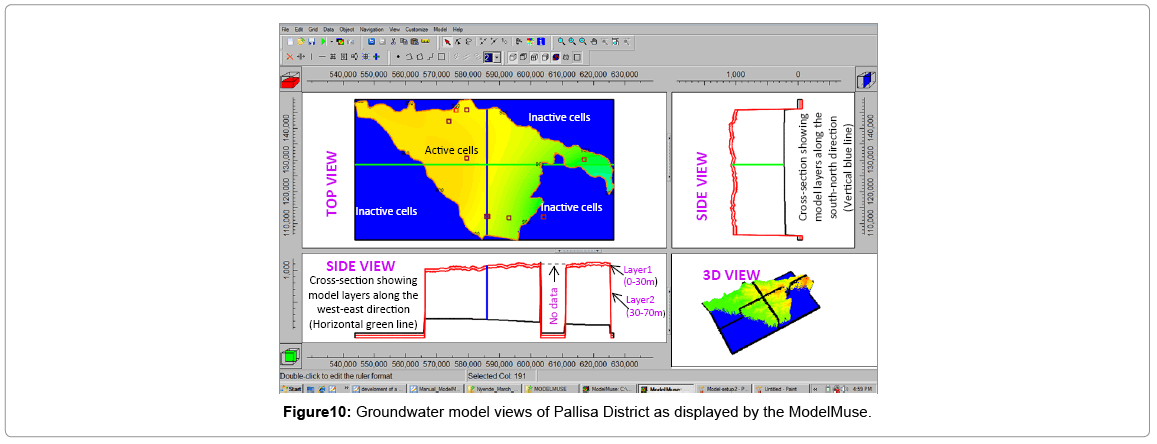
Figure 10: Groundwater model views of Pallisa District as displayed by the ModelMuse.
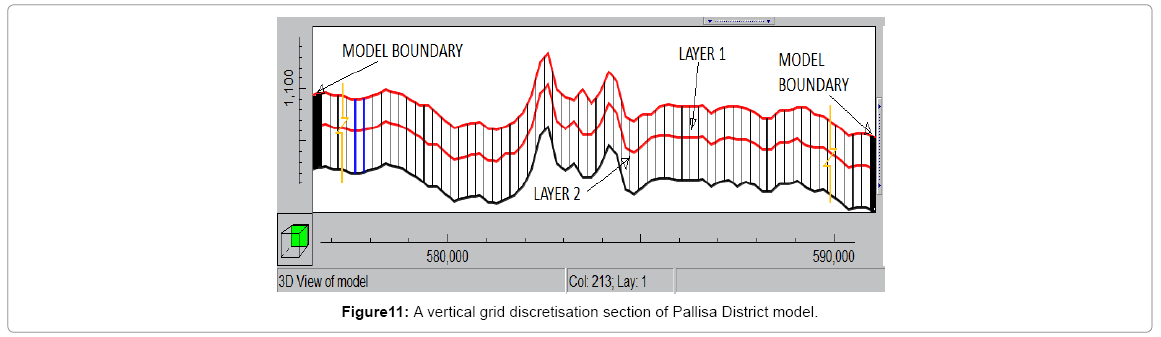
Figure 11: A vertical grid discretisation section of Pallisa District model.
To ease on the computational processes, a two-layered aquifer was considered as in Figure 10 and in a detailed exaggerated vertical discretised grid, Figure 11. The geometry, boundary conditions, and hydraulic properties used in the model are summarised in Tables 2-4. The 92-m resolution topographic map of Pallisa District obtained from the Directorate of Water Resources Management Entebbe was twice resampled to 250-m resolution by Arc Map v9.3 and spatially analysed using Arc View v3.2a to raster then imported as objects to ModelMuse at the specified elevations of 0, 30 and 70 mbgl. The two layers thicknesses were estimated based on the existing geological maps, cross-sections, borehole logs and field reconnaissance.
| Layer | Type | Horizontal KAH [m/s] | Vertical KAV [m/s] | Storage Coefficient S [-] |
|---|---|---|---|---|
| 1 | Regolith | 5E-06 | 5E-07 | 0.03 |
| 2 | Bedrock | 1E-08 | 1E-09 | 0.00001 |
Table 2: Hydraulic parameters as applied to model layers (sogreah and Scet 1997; Boukari et al. 1985)
| Layer | Hydrogeologic Unit | Label Unit | Range of Thickness(m) | Lithologic and Hydrogeologic Characteristics |
|---|---|---|---|---|
| 1. | The Upper Saprolite with Low Permeability The Saprock Aquifer with High Permeability |
USLP |
≈≤0.5-5 ≈≤5-30 |
A convertible low permeability unit consisting of lateritic, schist and slightly yellow clay to moderately sandstone. Further down there is a noticeable high permeability, consisting of mostly of sand and gravel with some silt and meta sedimentary rocks |
| 2. | Basement Complex | BC | ≈≤70 | The unit consists of weathered, fractured convertible aquifer and fresh granite. |
Table 3: Aquifer units and their lithological description used as groundwater model layers.
| Number | Item | Details |
|---|---|---|
| 1 | MODFLOW Version | MODFLOW-2005 |
| 2 | GUI | ModelMuse |
| 3 | Grid cell size | 250 m |
| 4 | Rows | 200 |
| 5 | Columns | 373 |
| 6 | Layers | 2 |
| 7 | Cells per layer | 74,600 |
| 8 | Active cells per layer | 32,379 |
| 9 | Maximum Elevation | 1168.7 m |
| 10 | Minimum Elevation | -79.611 m |
| 11 | Model simulation Type | Steady state |
| 12 | Stress periods | 1 |
| 13 | Time step | 1 |
| 14 | Stress period duration | 9125 days |
| 15 | Length of Simulation | 9125 days |
| 16 | Programme control package | Basic (BAS) |
| 17 | Solver Package | Preconditioned Conjugate-Gradient (PCG) |
| 18 | Internal Flow Package | Layer Property Flow (LPF) |
| 19 | Boundary Package | RCH, WEL |
| 20 | Observations | Head observations |
Table 4: Summary of Pallisa District MODFLOW Model
Thus layer 1 represents the top model layer where the Digital Elevation Models (DEMs) are in line with the topographic contours of model thus the model polygon that extends from land surface to a depth of 30 m below land surface and simulates the regolith and upper highly weathered part of the crystalline formation is defined with formula [Model top=model_aquifer_upper_top as 0 m and model_ aquifer_upper_bottom as-30 m] (Figure 6).
While layer 2 represents the bottom model layer of slightly weathered granite unit and correspondence of the sparsely fractured granitic basement complex unit at the borders corresponding to the lower top aquifer bottom of -30 m and model lower aquifer bottom as -70 m in reference to the top. The second layer together with bedrock is modelled as unconfined/confined (convertible) type, however, bedrock basement is considered inactive in order to simplify the model.
Numerical groundwater modelling
Topographic data: Values of contour maps were set by interpolation for each layer with digital topographic map prepared with Arc View v3.2a and Arc Map v9.3 in determining the cell elevations. The altitude of the ground surface in the study area was adapted from DEM surveys conducted by the Department of Geological Surveys and Mines, Entebbe Uganda (Figures 7) before re-sampling.
Elevations of model top and the bottom topography of the active domain limit range from 0-≈30 mbgl and from ≈ 30-≈70 mbgl, respectively. All the layers were mainly constructed to represent different properties of the regolith and basement aquifers
Numerical code selection: The numerical model code to simulate Pallisa District is based on the U.S. Geological Survey Model Muse. A Graphical User Interface (GUI) for MODFLOW-2005 [30] is a threedimensional finite-difference groundwater model. Its selection is justifiable in that: First, it simulates steady and no steady flow in an irregularly shaped flow system in which aquifer layers can be confined, unconfined, or a combination. Second, it allows the user to define the spatial input for the models by drawing points, lines, or polygons on top, front, and side views of the model domain. Third, the points, lines, and polygons can assign data set properties at locations that are enclosed or intersected by them or by interpolation among objects. Fourth, Model Muse program is relatively easy to understand and freely available on the Internet at address: http://water.usgs.gov/software/. Fifth, it can be applied to realistic conditions and it can be used for future developments of the model.
Hydrogeological data: The observation wells, mentioned in the sub-section on geological data, were used to measure the water table in the study area during 2001 and 2003 [19]. According to Kulabako [21], the first two layers (the regolith and the basement complex) had values ranging from 10-3-10-5 m/s (0.864-86.4 m/d), whereas the vertical hydraulic conductivity in the bottom layer is mentioned to be 1-3*10-7 m/s (0.00864-0.02592 m/d).
Time frame/data selection: From June 2010 to August 2011, the nested wells PL001, PL003, PLCAK22, PLK004, PALKBK and PL080 were monitored. Thus data (precipitation, observation well measurements, etc.) for the year 2010 is used for the simulation. Considering that the total annual precipitation of 2010 was 1 250 mm/ year, which is very close to the mean annual value of 1300 mm/year for the study, the results of the modelling may also be applicable for an average year. For observation well PL002, MTW1, OBW1, PLTW1 and OBW4 the missing data were interpolated from the given preceding. From the pumped wells, the transmissivity of the fractured aquifers in the Kyoga catchment vary from 0.76 to >52 m2/d. Available resistivity data, drilling records, geology, soil and the knowledge gain from the previous studies were also integrated to demarcate the hydrostratigraphic units of the study area. The analysis of the geophysical data distinguished different layers within the study area.
Groundwater recharge: Groundwater recharge is defined as the entry into the saturated zone of water made available at the water table surface together with the associated flow away from the water table within the saturated zone [31]. According to Gaspa [32] a value of 189 mm/year is given, which is about 15% of the average annual precipitation. This is in view of the low level of urbanisation; the soils in the study area are likely to be less compacted than is generally the case of Pallisa town. Therefore, a higher infiltration rate of was applied. For this study it is assumed that return flow from irrigation system is insignificant due to unavailability of reliable flood data in the recharge system of the study area. Hence irrigation return flows were not accounted for in the model directly.
Pallisa District model boundaries: Pallisa District is adjacent to Lake Kyoga that lies in the Kyoga Basin. The areas not covered by the model boundary were considered a no flow boundary condition which in this case of the mountain ranges and hills in the plains with outcrops and were considered impermeable to groundwater flow. The western part and southern part of the model boundary was assigned a no flow boundary with the assumption that surface water divide coincides with the groundwater divide. The two Rivers Mpologoma and Dodoi were excluded from the boundary due to lack of leakage factor and the measured amount of recharge from them. Also due to lack of data the study assumed that all the streams enter through this boundary and flows to the Lake Kyoga are without any contribution to recharge along the boundary. All in all, the entire study area is surrounded by a no-flow boundary (Figure 8).
Flow governing modelling equations
Modelling approach: Groundwater flow of the study area aquifer system is simulated using the USGS three-dimensional finite-difference groundwater saturated flow model MODFLOW. The Darcy´s law, in equation1, for an incompressible fluid is used to introduce the hydraulic heads in the expression:
qx=-Kx.δh/δx; qy=-Ky δh/δy and qz=-Kz.δh/δz (1)
Where: Kx, Ky and Kz are hydraulic conductivities along the direction x, y and z (LT-1); h is the hydraulic head (L); and qx, qy and qz represents the volumetric flow rate per unit area (L).
The general flow equation of MODFLOW translates the physical system into the mathematical governing equations in saturated porous media: the steady-state and the continuity of motion are based on the following well-known three–dimensional partial difference shown in equation 2 (Bossinesq) solved was for (h, y, z and t).
 (2)
(2)
where;
Kxx, Kyy and Kzz represent the hydraulic conductivities along the x, y and z coordinate axes, (LT-1); is the potentiometric or hydraulic head, (L); W (T-1) is the volumetric flux per unit volume representing sources or sinks of water being pumped from the aquifer, with W-ve) for flow out of the groundwater system, and W>0 (+ve) for flow into the system (T-1); SS is the specific storage of porous material (L-1); t is the time in days; δh/δx, δh/δy, δh/δz are the respective temporal hydraulic gradients; and δh/δt is the temporal; derivative of the hydraulic head.
When there is sufficient reason to assume steady state conditions, the terms on the right side of equation 2 become zero. A steady-state flow occurs when at any point in a flow system, the magnitude and direction of the flow velocity are constant in time.
Aquifer material properties: The top elevation and the bottom elevation of the two layers were also provided; the values for the top and bottom of the aquifers were estimated from DEMs of the topographical map of Pallisa obtained from the data bank of Water Resources Management Directorate in Entebbe.
Parameter values-hydraulic conductivity and transmissivity: The average hydraulic conductivity for layer 1 is estimated from groundwater literature depending on the geologic and hydrogeological properties of the aquifer unit and pumping tests carried out (Table 2). The average hydraulic conductivity of layer 2 of the model (main aquifer) is estimated from aquifer test data of 12 boreholes drilled in the study area at different times that ranges from 1.5 m/d for deep wells located near the hill sides to 10 m/d for wells for wells drilled towards Lake Kyoga alluvium aquifers. Transmissivity for the layer 2 of the model was calculated from the pumping test result that is by multiplying the horizontal hydraulic conductivity by the total length of the screen and contoured for equal hydraulic conductivity areas.
The characterisation of the hydraulic properties of the regolith varies from 1E-04 m/s to 1E-08 m/s. In respect to the regional scale, the fractured bedrock was considered as a porous medium with a lower permeability as described above. The values applied in Table 2 are found during the process of model calibration.
Recharge areas/zones: The re-sampled recharge map by Arc Map v9.3 was imported into ModelMuse as an object and assigned uniformly on the whole of the active layer of the model and corresponds from approximately 100-230 mm/year (Figure 9) where the raw data with a 90-m grid resolution were obtained directly from DWD/WRMD 2007- 2010 project before re-sampling. The recharge map was re-sampled to 250-m resolution and converted into raster then to ASCII before importing variations in recharge that accounts for 8-18% of the annual precipitation in the study area. This is dependent on the number of heavy (more than 10 turn/d) rainfall events than the total volume of rainfall. The various recharge values are based upon geology encountered during the investigation into the Pallisa area and confirmed through the actual drilling work. However, zones located in the lower western and north-western contribute high recharge and reduces towards the upper part of the catchment (Kakoro). In ModelMuse, the MODFLOW recharge package is designed to simulate naturally occurring recharge to the groundwater. The recharge therefore, was only applied to the upper layer to the most active cells, allowing the vertical hydraulic conductivity to determine the amount of water flowing from the upper to the lower layer. The second aquifer/lower aquifer is underlain by a dense granitic formation. Therefore, the base of the model is simulated by no-flow cells located 70 m below land surface
However, the data used to define the hydrostratigraphic units contain the essential information that assisted to reproduce the actual condition of the flow system in the study area. Table 3 is related to Figure 10 and Table 4 provides the summary of the model.
Results of Modelling
Model configuration
Groundwater abstraction: Groundwater abstraction is simulated using the Well (WEL) package for MODFLOW 2005 [30] and supported ModelMuse. The Well Package is designed to simulate wells which withdraw water from the aquifer (and in the other add water to it) at a specified rate [Q (m3/d)] independent of both the cell area and the head in the cell [33]. In here, the Well Package uses the hydraulic conductivity and thickness to determine how much of the well pumpage is derived from each model layer. This allows pumpage to be redistributed as the estimates of the hydraulic conductivity distribution change during model calibration. Figure 11 shows the positions of the pumping and observation wells in Pallisa District (Table 4).
Observation wells: In total eight (8) observation wells (abstraction wells at infinitesimal distances and observation wells) were considered for the groundwater model-one set of five wells in the upper aquifer and another set of three in the lower aquifer (Figure 12). But the poorly quantified or unquantified characteristics of the fractured system can be constrained on the basis of observations. These observations used in calibrating the Pallisa model are measured hydraulic heads (Modflow initial heads-water levels) in the above wells (Figure 12). The idea behind is that the measured hydraulic heads at these points reflect a general long-term steady state level of groundwater. This is clearly seen in the log transform map (Figure 13).
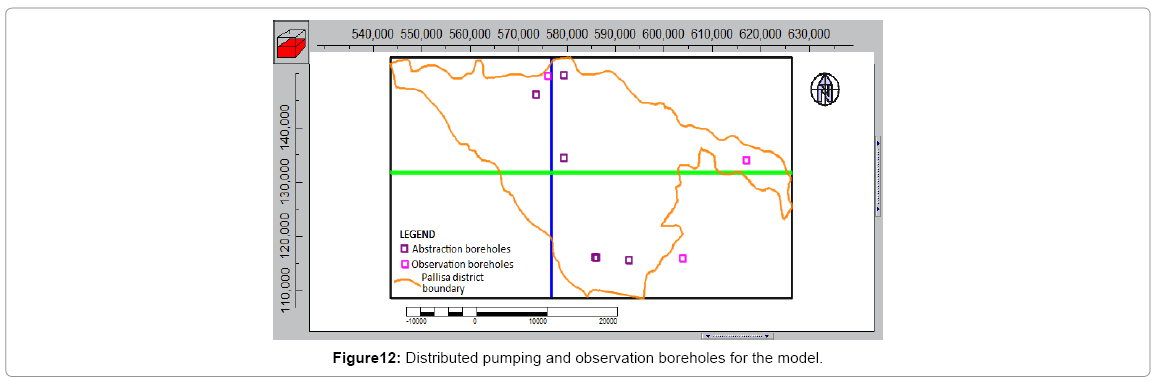
Figure 12: Distributed pumping and observation boreholes for the model.
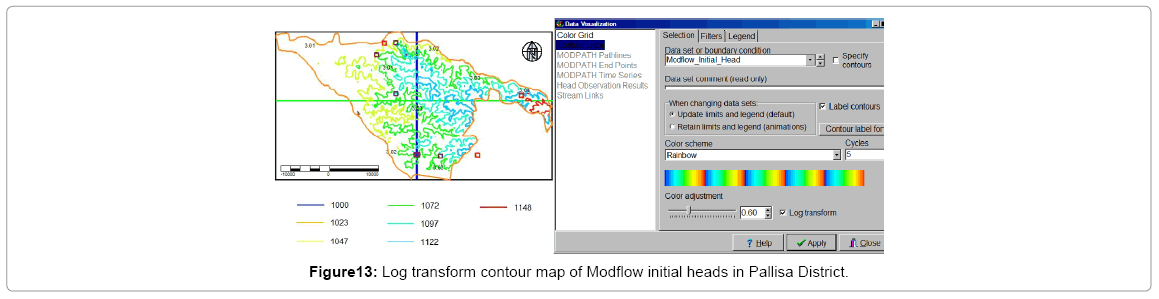
Figure 13: Log transform contour map of Modflow initial heads in Pallisa District.
Calibration of Pallisa District model: During the steady-state calibration process, the various input parameters were adjusted within reasonable limits and the results noted. The calibration of Pallisa District was evaluated through analysis of residuals. A residual is the difference between the observed and simulated variable [34] (denoted by residual=observed head-simulated head). The quality of calibration is illustrated by the plot residuals in Figure 14 which show a random distribution of both the positive residuals (coloured red) and the negative residuals (coloured blue). This is an indication of a well simulated model.
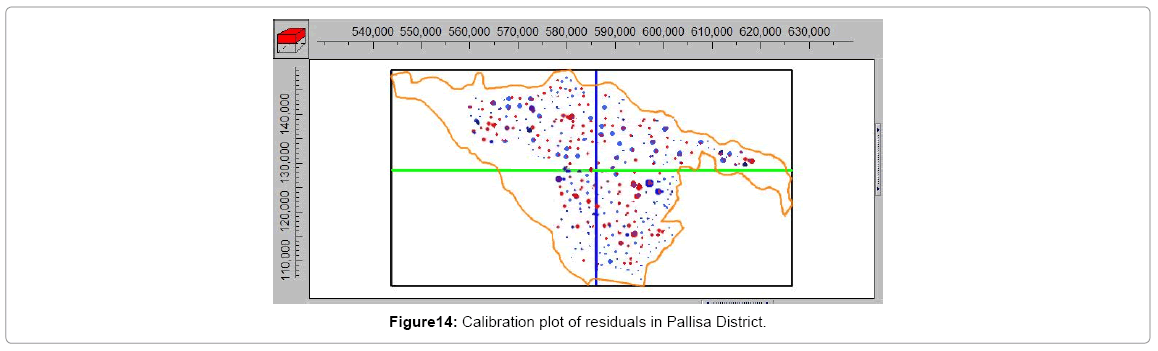
Figure 14: Calibration plot of residuals in Pallisa District.
Sensitivity analysis and predictive simulations: A sensitivity analysis was not performed to evaluate the sensitivity of the model output to uncertainties inherent in the input data and further, the current groundwater flow model was not used to predict potential groundwater resources due to the complexity of the hydrogeology/ geology and the uncertainty of accurately depicting the conceptual hydrogeological model for the study area.
Model assumptions and limitations: The Pallisa numerical groundwater model is a representation of the naturally occurring condition. However, several general assumptions were made in developing and simulating the groundwater flow model, while certain limitations also persisted in representing the natural conditions. The following assumptions are considered: (1) Fractured and weathered zones through which water flows are porous media and obey the Darcy’s Law when simulating the flow system; (2) Net recharge from precipitation is not spatially uniform due to heterogeneity in spatial distribution of hydraulic conductivity, geology, total precipitation and slope; (3) the aquifer properties are assumed homogeneous and isotropic within each of model cells. Faults are not assigned to specific regions and therefore not explicitly modelled. (4) The presence of dykes is unclear in the geology of the study area and therefore, was disregarded; (5) no discharge was included as there is no significant water extraction from the Mpologoma River.
Uncertainties and constraints: Simulation of the steady state condition of the groundwater system was done. However, there are uncertainties and constraints in input parameters involved:
1. The major constraints to regional modelling in Pallisa are explained below. A quantification of the error of the calculation of the piezometric heads in the model was not possible. The reason was that a fractured environment was modelled as a porous medium. However, the modelling results (Figure 14) represent an average solution;
2. The model covers an area of around 1585 km2. The smooth changes of the vertical terrain elevation are negligible when compared to the horizontal model extension. An intensive mesh refinement is necessary in order to achieve a better representation of the surface demands, an extensive computational power and a good refined digital elevation model as input source;
3. The conceptual model makes no difference either for the differing bedrock types or for the regolith formed through weathering out of the first. The major reasons are:
• Lack of consistent data about relevant outcrops and boreholes and
• The unrefined level of the hydrogeological and geological maps available for the study area.
The achieved data gave no clue for differing hydraulic characteristics of the bedrock. As consequence the developed conceptual model generalises the main flow components for the whole study area and fractures in the crystalline bedrock are nonetheless, often discontinuous and inherently possess such low storability that prolonged or intensive abstraction from the aquifer depends on leakage from the more porous overburden. Hence, the bedrock layer is modelled like a porous, homogeneous continuum.
Discussion of the Model
The main objective of modelling the study area was to have a better understanding of the groundwater flow system in Pallisa District. As it was described in the results, there are still uncertainties concerning the groundwater flow system in Pallisa that lie in the Kyoga basin.
The model could be improved by re-examining the conceptual model. Future data collection should include many more spring discharge and aquifer head measurements. The process used in this project demonstrates the use of a preliminary model in an interpretive sense and illustrates the strength of a groundwater flow model as a framework for organising available field data and for identifying deficiencies in the existing database.
The groundwater contours portray the nature of the lithology, geography, and the fact that groundwater flow is controlled by secondary permeability imposed on the rocks through fracturing and weathering. Both the highest and lowest groundwater levels in the study area are associated with the granites. In the northern sections of the study area, where the ground elevations are the highest in the area, the lowest groundwater levels have been noted. In the Southern parts, the groundwater level is quite high, and coincides with the topographic law. This observation is in keeping with the general knowledge in hydrogeology that the surface topography is a subdued replica of the groundwater table elevation. The topographically high elevation (Kakoro area) has a low recharge.
A plot of the observed heads against the model calculated heads is illustrated by the even distribution of the residuals (Figure 14). Stream flow data was not available due to the lack of stream gauges in the study area. Whereas there is a large proportion of groundwater base flow to the stream flow rates, groundwater recharge from streams in the area is not known. Field investigations indicate the presence of open wells and springs which may contribute substantially to stream flow, but this require further investigation.
Conclusions
The modelling process produced a preliminary groundwater flow model that serves to support the understanding of existing hydrogeological conditions. The original intent of the model is for use in the evaluation of potential groundwater resources. However, due to the complexity of the geology/hydrogeology and the uncertainty of accurately defining the conceptual hydrogeological model for the area under investigation, use of this groundwater model is limited to developing a general understanding of potential groundwater resources for the rural poor communities. The information data collected to date, the conceptual geologic/hydrogeological model developed for the study area, and the results of the groundwater water flow model should be used as the basis for an initial improved understanding of Pallisa District groundwater flow system. Increasing the groundwater flow model’s effectiveness to be used as a tool to manage the rural poor communities of Pallisa groundwater resources will be achieved by optimising the conceptual and groundwater flow model through the collection of additional geologic and hydrogeological information. With this additional geologic and hydrogeological information, the usability of the model will increase. Therefore, this framework provides a basis and context for conducting more detailed studies to confirm the results highlighted and to fill the gaps that have been left unanswered For further groundwater resource development plans in Pallisa, it is important to take into account the balance between the groundwater recharge and the intended abstraction rates both for the proposed domestic water supply and the limited irrigation to ensure the sustainability of the resource in Pallisa District. Importantly is to revise/reduce the boreholes’ separation distances.
• Flow velocities are different throughout the system. These occur more rapid in areas where porosity and transmissivity are high and lower in relatively flat areas; and
• In this study, the thickness of the fractured aquifer was assumed from the selected cross-section.
However, for a better accuracy it needs further investigation as it has impact on the model simulation. The thickness of the aquifer is inferred from the newly shallow drilled and existing borehole data and the regolith aquifer is assumed to be hydraulically connected with the underlying fractured granitic aquifer. This assumption needs further field verification through different deep drilled wells.
Nonetheless, this approach was insufficient to improve calibration in areas known for the presence of structural controls that may influence groundwater flow patterns. Given de amount and quality for data for calibration, model results were acceptable as measured by standard statistics. Surely, the availability of current piezometric levels, extraction volumes and discharges would help to produce a better model.
Acknowledgements
This study was supported by the Staff Development Committee of Kyambogo University and University of the Free State. The authors however, appreciate the contributions made by the Directorate of Water Resource Management and Pallisa District Water Office for the preliminary data. Special thanks to the Lukas and Paul for the software availability.
References
- Bates BC, Kundzewicz ZW, Wu S, Palutikof JP (2008) Climate Change and Water. Technical Paper of the Intergovernmental Panel on Climate Change, IPCC secretariat, Geneva, Switzerland.
- Gburek WJ, Folmar GJ, Urban JB (1999) Field data and groundwater modeling in a layered fractured aquifer. Groundwater 37: 175-184.
- Lebbe L, De BW (1995) Validation of an inverse numerical model for interpretation of pumping tests and the study of factors influencing accuracy of results. Journal of Hydrology 172: 61-85.
- Moench AF (1997) Flow to a well of finite diameter in a homogeneous, anisotropic water table aquifer. Water Resources Research 33: 1397-1407.
- Wright EP, Burgess WG (1992) The hydrogeology of crystalline basement aquifers in Africa. Special Publications 66: 1-27.
- Chilton PJ, Foster SD (1995) Hydrogeological characteristics and water supply potential of basement aquifers in tropical Africa. Hydrogeology Journal 3: 36-49.
- Ayenew T, Demlie M, Wohnlich S (2007) Application for numerical modeling for groundwater flow system analysis in the Akaki Catchment, Central Etihiopia. Int Assoc Mathemat Geol 40: 887-906.
- Tóth J (1963) A theoretical analysis of ground water flow in small drainage basins. J Geophys Res 68: 4795-4812.
- Howard KW, Karundu J (1992) Constraints of the development of basement aquifers in East Africa - water balance implications and the role of the regolith. J Hydrol 139: 183-196.
- Rodhe A, Bockgard N (2006) Groundwater recharge in a hardrock aquifer: A conceptual model including surface loading effects. J Hydrol 330: 389-401.
- Lucinda M, Taylor RG, Todd M, Tindimugaya C, Thompson J (2009) The impact of climate change on groundwater recharge and runoff in a humid, equatorial catchment: sensitivity of projections to rainfall intensity. Hydrologic Sci J 54: 727-738.
- Mwesigwa D, Tindimugaya C (2009) Design of an issue-based groundwater monitoring network in Uganda: In groundwater and Climate in Africa. Proceedings of the Kampala conference - 2008, Uganda.
- Taylor R, Miret-Gaspa M, Tumwine J, Mileham L, Flynn R, et al. (2008) Increased risk of diarrhoeal diseases from climate change: evidence from urban communities supplied by groundwater in Uganda. In Groundwater and Climate in Africa Publications, IAHS Publication 334: 15-19.
- Tindimugaya C (2008) Groundwater flow and storage in weathered crystalline rock aquifer systems of Uganda: evidence from environmental tracers and aquifer responses to hydraulic stress. University College London, UK.
- Owor M, Taylor RG, Tindimugaya C, Mwesigwa D (2009) Rainfall intensity and groundwater recharge: empirical evidence from the Upper Nile Basin. Environmental Resource Letters 4.
- Taylor GT (1998) Tectonically controlled landscape evolution and its relation to lithology, hydrology and hydrogeology of weathered crystalline rocks in Uganda. National Library of Canada, University of Toronto, Canada.
- Taylor RG, Howard KW (1999b) The influence of tectonic setting on the hydrological characteristics of deeply weathered terrains: evidence from Uganda. J Hydrol 218: 44-71.
- Owor M, Taylor R, Thompson J, Mukwaya C, Tindimugaya C (2008) Monitoring groundwater-surface water interactions in the Upper Nile Basin of Uganda: In Groundwater and climate in Africa. Proceedings of the Kampala Conference - 2008, Uganda.
- Nyende J (2003) Evaluation of Groundwater Resource Potential of Pallisa District in eastern Uganda. Unpublished MSc. University of the Free State, Republic of South Africa.
- Kröhn KP, Zielk W (1990) Modelling transport in discrete fracture systems with a finite element scheme of increased consistency. Computational methods in surface hydrology. Computational Mechanics Publications, Boston, USA.
- Kulabako R (2005) Analysis of the impact of anthropogenic pollution on shallow groundwater in peri-urban Kampala. Royal Institute of Technology, Stockholm, Sweden
- Sogreah, Scet (1997)Potentialités des aquifères discontinus des formations du socle. MMEH and MPREPES, Cotonou, Benin.
- Boukari M, Guiraud R (1985) L'hydrogeologie des regions de socle de l'Afrique intertropicale: l'exemple de Dassa-Zoume (Benin meridional). J Africa Earth Sci 3: 491-503.
- Blum P, Mackay R, Riley M, Knight J (2007) Hydraulic modelling and determination of the representative element volume (REV) on gulf rock. Groundwater 12: 48-65.
- Bear J (1972) Dynamics of fluids in porous media. Environmental science series. Elsevier, Amsterdam.
- Min K, Jing L, Stephansson O (2004) Determining the equivalent permeability tensor for fractured rock masses using a stochastic REV approach: method and application to the field data from Sellafield, UK. Hydrogeol J 12: 49-510.
- Baghbanan A, Jing L (2007) Hydraulic properties of fractured rock masses with correlated fracture length and aperture. Int J Rock Mechan Mining Sci 44: 704-719.
- Dietrich P, Helmig R, Sauter M, Hötzl H, Köngeter J, et al. (2005): Flow and transport in fractured porous media. Springer, Berlin, Germany.
- Kohl T, Megel T (2007) Predictive modelling of reservoir response to hydraulic stimulations at the European EGS Site Soulz-sous-Forets. Int J Rock Mechan Mining Sci 44: 1118-1131.
- Harbaugh AW (2005) MODFLOW-2005 The U.S. Geological Survey modular ground-water model-The ground-water flow process: U.S. Geological Survey Techniques and Methods, USA.
- Freeze RA, Cherry JA (1979) Groundwater, Prentice-Hall, Englewood Cliffs, New Jersey, USA.
- Gaspà M (2004) Use of hydrochemical, microbiological and physical monitoring to determine contamination mechanisms of spring water discharging from a deeply weathered regolith aquifer, Kampala-Uganda. University of Neuchâtel, Switzerland.
- McDonald MG, Harbaugh AW (1988) A modular three-dimensional finite-difference ground-water flow model. US Geological Survey, USA.
- ASTM International (2004) Standard Guide for Application of a Ground-Water Flow Model to a Site-Specific Problem, USA.
Citation: Nyende J, Van TG, Vermeulen D (2013) Conceptual and Numerical Model Development for Groundwater Resources Management in a Regolith-Fractured- Basement Aquifer System. J Earth Sci Clim Change 4: 156. Doi: 10.4172/2157-7617.1000156
Copyright: ©2013 Nyende J, et al. This is an open-access article distributed under the terms of the Creative Commons Attribution License, which permits unrestricted use, distribution, and reproduction in any medium, provided the original author and source are credited.
Share This Article
Open Access Journals
Article Tools
Article Usage
- Total views: 17102
- [From(publication date): 10-2013 - Apr 20, 2024]
- Breakdown by view type
- HTML page views: 12003
- PDF downloads: 5099